BNB Price Breaks $600, Why Bulls Could Now Aim New ATH
BNB price is gaining bullish momentum above the $550 resistance. The price is showing positive signs and might extend its rally above $650. BNB price is up over 15% and it broke the $600 resistance zone. The price is now...

BNB price is gaining bullish momentum above the $550 resistance. The price is showing positive signs and might extend its rally above $650.
- BNB price is up over 15% and it broke the $600 resistance zone.
- The price is now trading above $580 and the 100 simple moving average (4 hours).
- There is a key bullish trend line forming with support at $598 on the 4-hour chart of the BNB/USD pair (data source from Binance).
- The pair could continue to rise toward the $650 resistance zone or even $700.
In the last BNB price prediction, we discussed the chances of more gains above the $500 resistance zone. The price continued to rise and broke many hurdles near the $550 level.
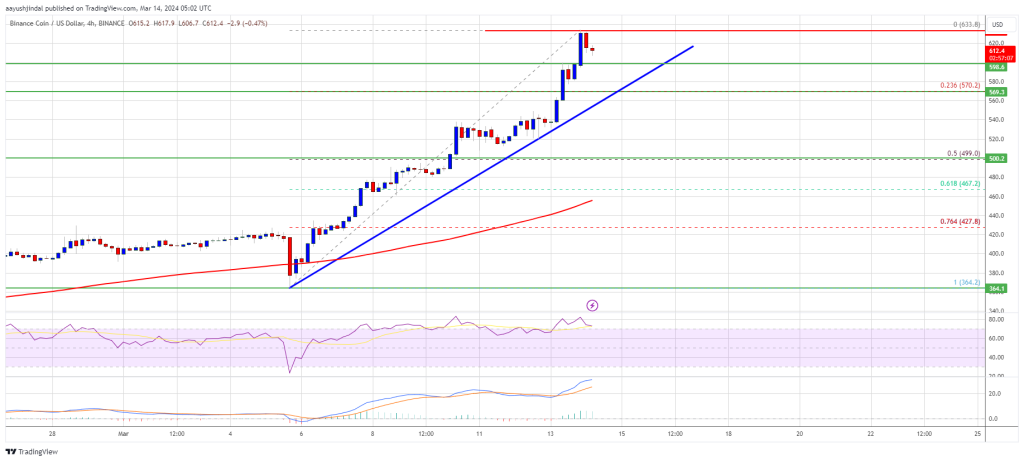
BNB is now outperforming Bitcoin and Ethereum with a move above the $580 resistance. It is up over 10% today and trading above $600. A high was formed near $633 and the price is now consolidating gains. It is trading above the 23.6% Fib retracement level of the upward move from the $364 swing low to the $633 high.
The price is now trading above $600 and the 100 simple moving average (4 hours). Immediate resistance is near the $625 level. The next resistance sits near the $635 level. A clear move above the $635 zone could send the price further higher.
Source: BNBUSD on TradingView.com
In the stated case, BNB price could test $650. A close above the $650 resistance might set the pace for a larger increase toward the $700 resistance. Any more gains might call for a test of the $780 level in the coming days.
Dips Limited?If BNB fails to clear the $635 resistance, it could start a downside correction. Initial support on the downside is near the $600 level and the trend line.
The next major support is near the $570 level. The main support sits at $500 or the 50% Fib retracement level of the upward move from the $364 swing low to the $633 high. If there is a downside break below the $500 support, the price could drop toward the $450 support. Any more losses could initiate a larger decline toward the $420 level.
Technical Indicators
4-Hours MACD – The MACD for BNB/USD is gaining pace in the bullish zone.
4-Hours RSI (Relative Strength Index) – The RSI for BNB/USD is currently above the 50 level.
Major Support Levels – $600, $570, and $500.
Major Resistance Levels – $635, $650, and $700.
Original source
Read on NewsBTCRelated market context

Bitcoin Stabilizes Near Key Zone, But Glassnode Warns Capital Flows Remain Weak
Bitcoin’s rebound from the $60,000 area has given bulls something to work with, but Glassnode’s latest market read suggests the re...

BTC News Today: Bitcoin Climbs Toward $66K as Trump Reveals US-Iran Peace Deal
The renewed geopolitical optimism helped improve risk sentiment across financial markets, pushing Bitcoin back toward the $66,000...

XRP Price Prediction: Ripple Jumps 10% as Crypto Total Market Cap Closing $2.4T
XRP price is moving again, and this time, prediction and volume back it up. The token has run 10% in the past 24 hours, pushing th...

XRP Price Prediction: US-Iran Peace Deal Fuels 13% XRP Surge, Analysts Target $1.94 Retest
The latest move saw XRP price today reclaim the $1.28 level for the first time in nearly two weeks. Market participants pointed to...

Bitcoin Price and Crypto Stocks Surge as Iran Ceasefire, Strategy’s $100M Buy Collide With Fed Week
Bitcoin Magazine Bitcoin Price and Crypto Stocks Surge as Iran Ceasefire, Strategy’s $100M Buy Collide With Fed Week Bitcoin price...

Congress moves to rebuild crypto crime task force after DOJ dismantled its dedicated crypto team
Congress wants a task force for cryptocurrency theft months after the Justice Department disbanded NCET. The proposal, introduced...