BNB Price Clears $250 and Could Rally 10% To Retest This Key Resistance
BNB price gained momentum and climbed above the $250 resistance. It is showing positive signs and might rally toward the $272 resistance zone. BNB price is moving higher above the $250 resistance. The price is now tradin...
Archive context
Older archive item. Useful for background and entity history, but not a fresh market-moving signal.

BNB price gained momentum and climbed above the $250 resistance. It is showing positive signs and might rally toward the $272 resistance zone.
- BNB price is moving higher above the $250 resistance.
- The price is now trading above $250 and the 100 simple moving average (4 hours).
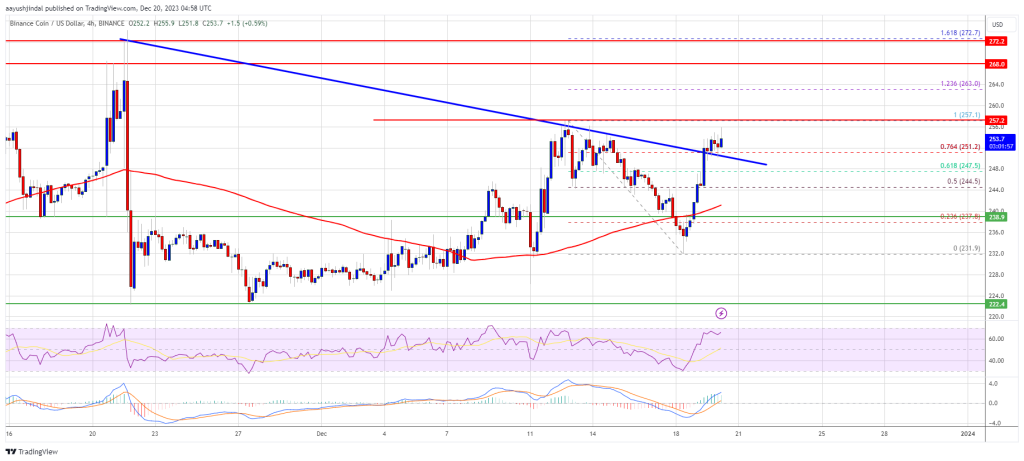
- There was a break above a key bearish trend line with resistance near $252 on the 4-hour chart of the BNB/USD pair (data source from Binance).
- The pair might continue to move up if there is a clear move above $258.
These past few days, BNB price formed a base above the $230 level. The price started a decent increase above the $240 and $242 resistance levels. In the past two sessions, it even outperformed Ethereum and Bitcoin.
BNB broke the 76.4% Fib retracement level of the downward move from the $257.1 swing high to the $231.9 low. There was also a break above a key bearish trend line with resistance near $252 on the 4-hour chart of the BNB/USD pair.
It is now trading above $250 and the 100 simple moving average (4 hours). The current price action is positive and signaling more upsides above the $258 resistance zone.
The next resistance sits near the $262 level. A clear move above the $262 zone could send the price further higher. In the stated case, BNB price could test $272. It is close to the 1.618 Fib extension level of the downward move from the $257.1 swing high to the $231.9 low.
Source: BNBUSD on TradingView.com
A close above the $272 resistance might set the pace for a larger increase toward the $285 resistance. Any more gains might call for a test of the $300 level.
Downside Correction?If BNB fails to clear the $258 resistance, it could start a downside correction. Initial support on the downside is near the $248 level.
The next major support is near the $242 level. The main support sits at $232. If there is a downside break below the $232 support, the price could drop toward the $222 support. Any more losses could initiate a larger decline toward the $205 level.
Technical Indicators
4-Hours MACD – The MACD for BNB/USD is gaining pace in the bullish zone.
4-Hours RSI (Relative Strength Index) – The RSI for BNB/USD is currently above the 50 level.
Major Support Levels – $248, $242, and $232.
Major Resistance Levels – $258, $272, and $285.
Why this matters
This altcoin story adds another data point to the current market tape and is useful when read alongside nearby source coverage.
Original source
Read on NewsBTCRelated market context

XRP Price Prediction: Can the CLARITY Act Fuel Recovery as XRP Nears Critical $1.02 Confluence Support?
At the same time, progress on the CLARITY Act is keeping XRP and broader crypto market regulation in focus. Combined with XRP’s ke...

Crypto News, June 26: Bitcoin Price Retested $58K, Ethereum Touched Double Bottom, MSTR Crashes, $3Billion Outflow – Time to Stack Sats?
Today might be a bad weekend, as it arrived with one of the largest options expiries of the year. Bitcoin price retested lower lev...
UK bond fund ownership records move onto Ethereum and Solana accessible 24/7
A UK investment manager with over £286 billion ($377B) in assets under management is testing a sharper version of fund tokenizatio...

XRP Price Prediction: XRPL Could Be The Backbone of UK Climate Bond
XRP price prediction is not improving, but a formal UK parliamentary proposal names the XRP Ledger as the preferred blockchain inf...
Bitcoin Price Prediction: $10 Billion Option Expiry Looming – Tomorrow Is The Make or Break Point
Bitcoin price is sitting at $61,000, after the bounce was rejected at just under $63K, while its prediction is getting bearish. Bu...

Mark Zuckerberg Meta AI Predicts Eye-Opening XRP Price by End of 2026
Mark Zuckerberg Meta AI just built a 2026 predicts for XRP price prediction that reads less like a single number and more like thr...