BNB Price Eyes $600 Milestone: Will Bulls Break The Barrier?
BNB price started a steady increase above the $550 resistance. The price is now consolidating and might aim for more gains above $585. BNB price started a decent upward move from the $500 support zone. The price is now t...

BNB price started a steady increase above the $550 resistance. The price is now consolidating and might aim for more gains above $585.
- BNB price started a decent upward move from the $500 support zone.
- The price is now trading above $550 and the 100-hourly simple moving average.
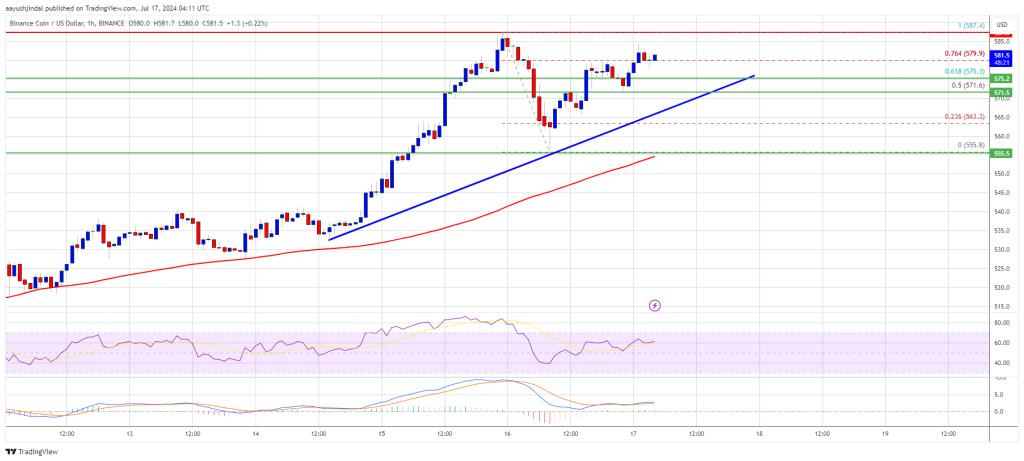
- There is a connecting bullish trend line forming with support at $572 on the hourly chart of the BNB/USD pair (data source from Binance).
- The pair could extend its increase if it clears the $588 resistance in the near term.
In the past few days, BNB price saw a decent upward move from the $500 support zone, like Ethereum and Bitcoin. The price was able to climb above the $535 and $550 resistance levels.
It even cleared the $570 resistance. The current wave surpassed the 61.8% Fib retracement level of the downside correction from the $587 swing high to the $555 low. The price is now trading above $550 and the 100-hourly simple moving average.
It is now consolidating above the 76.4% Fib retracement level of the downside correction from the $587 swing high to the $555 low. There is also a connecting bullish trend line forming with support at $572 on the hourly chart of the BNB/USD pair.
On the upside, the price could face resistance near the $585 level. The next resistance sits near the $588 level. A clear move above the $588 zone could send the price higher. In the stated case, BNB price could test $600.
A close above the $600 resistance might set the pace for a larger increase toward the $625 resistance. Any more gains might call for a test of the $640 level in the coming days.
Are Dips Supported?If BNB fails to clear the $588 resistance, it could start a downside correction. Initial support on the downside is near the $572 level or the trend line.
The next major support is near the $564 level. The main support sits at $550. If there is a downside break below the $550 support, the price could drop toward the $535 support. Any more losses could initiate a larger decline toward the $520 level.
Technical Indicators
Hourly MACD – The MACD for BNB/USD is gaining pace in the bullish zone.
Hourly RSI (Relative Strength Index) – The RSI for BNB/USD is currently above the 50 level.
Major Support Levels – $572 and $564.
Major Resistance Levels – $588 and $600.
Original source
Read on NewsBTCRelated market context

Uranium Holds Above $85 as Mining ETF Rebounds From June Sell-Off
The latest charts display that the market is divided into stable physical prices and uranium shares trying to regain momentum afte...

Standard Chartered Says Bitcoin Bottomed Near $59,000 As Crypto Winter Ends
TL;DR Standard Chartered’s Geoffrey Kendrick reportedly says Bitcoin’s $59,000 area marked the cycle bottom. The note cites SpaceX...

Elon Musk SpaceX AI Predicts Incredible Bitcoin Price For Next 30 Days
Here is the thing about capitulation calls. They only sound smart in hindsight. Right now, with Bitcoin price scraping along the l...

Bitcoin Mining Cost Model Points To $47,000 Floor, But Analysts Urge Caution
TL;DR Crypto Rover says Bitcoin has never bottomed below electrical production cost, currently estimated at $47,000. Mining-cost m...

Bitcoin rises above $64,000 after Pakistan prime minister says Iran peace deal is near
Bitcoin traded above $64,000 on Saturday, supported by its strongest ETF inflows in a month and growing optimism around geopolitic...

Tether USDT Briefly Overtakes Ethereum in Market Cap: A $187B Wake-Up Call
For a few hours, earlier this week, Tether USDT stablecoin held a higher market cap than Ethereum, the first time that has happene...