BNB Price Faces Crucial Test: Will $600 Withstand the Pressure?
BNB price is attempting a fresh increase from the $540 zone. The price must settle above the $600 resistance to gain bullish momentum. BNB price started a fresh increase after it cleared the $565 resistance zone. The pri...

BNB price is attempting a fresh increase from the $540 zone. The price must settle above the $600 resistance to gain bullish momentum.
- BNB price started a fresh increase after it cleared the $565 resistance zone.
- The price is now trading above $580 and the 100 simple moving average (4 hours).
- There is a key bullish trend line forming with support at $592 on the 4-hour chart of the BNB/USD pair (data source from Binance).
- The pair could gain bullish momentum if it clears the $602-$610 resistance zone.
After forming a base above the $535 level, BNB price started a fresh increase. There was a steady increase above the $565 and $575 resistance levels, like Ethereum and Bitcoin.
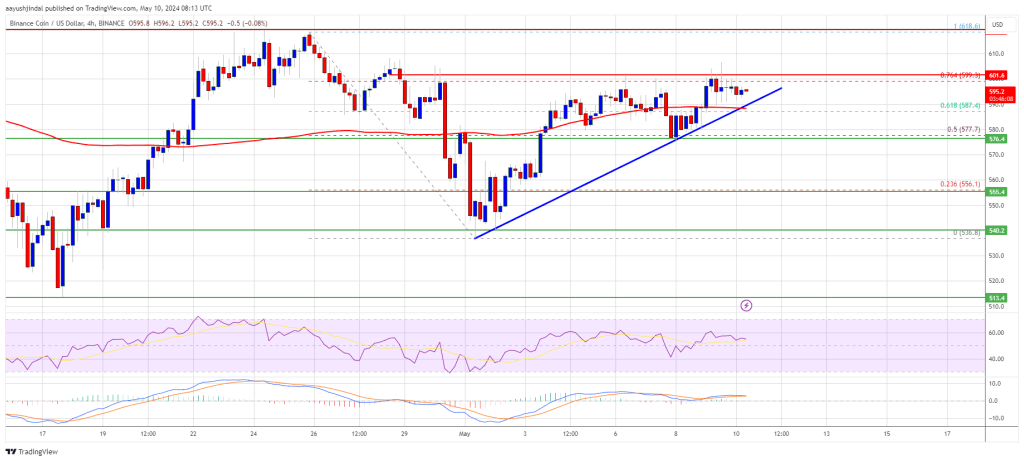
The bulls pushed the price above the $580 pivot level and the 61.8% Fib retracement level of the downward move from the $618 swing high to the $5382 low. It is now trading above $590 and the 100 simple moving average (4 hours).
There is also a key bullish trend line forming with support at $592 on the 4-hour chart of the BNB/USD pair. The pair seems to be consolidating near the 76.4% Fib retracement level of the downward move from the $618 swing high to the $5382 low.
Immediate resistance is near the $602 level. The next resistance sits near the $618 level. A clear move above the $618 zone could send the price further higher.
Source: BNBUSD on TradingView.com
In the stated case, BNB price could test $635. A close above the $635 resistance might set the pace for a larger increase toward the $650 resistance. Any more gains might call for a test of the $680 level in the coming days.
Are Dips Supported?If BNB fails to clear the $602 resistance, it could start a downside correction. Initial support on the downside is near the $592 level and the trend line.
The next major support is near the $578 level. The main support sits at $555. If there is a downside break below the $555 support, the price could drop toward the $530 support. Any more losses could initiate a larger decline toward the $520 level.
Technical Indicators
4-Hours MACD – The MACD for BNB/USD is gaining pace in the bullish zone.
4-Hours RSI (Relative Strength Index) – The RSI for BNB/USD is currently above the 50 level.
Major Support Levels – $592, $578, and $555.
Major Resistance Levels – $602, $618, and $650.
Original source
Read on NewsBTCRelated market context

Bitcoin Stabilizes Near Key Zone, But Glassnode Warns Capital Flows Remain Weak
Bitcoin’s rebound from the $60,000 area has given bulls something to work with, but Glassnode’s latest market read suggests the re...

XRP Price Prediction: US-Iran Peace Deal Fuels 13% XRP Surge, Analysts Target $1.94 Retest
The latest move saw XRP price today reclaim the $1.28 level for the first time in nearly two weeks. Market participants pointed to...

BTC News Today: Bitcoin Climbs Toward $66K as Trump Reveals US-Iran Peace Deal
The renewed geopolitical optimism helped improve risk sentiment across financial markets, pushing Bitcoin back toward the $66,000...

XRP Price Analysis: Ripple Token Eyes 10% Gain with Flashing Bullish Pattern and ETF Inflows
XRP price posts 9% moves today from low $1.1 to $1.24, with a prediction that it could go even higher. Two independent tailwinds a...

Bitcoin’s Iran rally faces Japan rate test as it weighs 31-year high
Bitcoin's current relief rally is built on the back of the framework agreement between the US and Iran to halt their conflict and...

3 Bullish Signals Are in: Bitcoin Now Faces Critical $83K Breakout Test
Three bullish signals have aligned for bitcoin, Standard Chartered said, while attention shifts to whether BTC can reclaim a key r...