BNB Price Gearing For Another Lift-Off to $300: Rally Isn’t Over Yet
BNB price (Binance coin) found support near $240 against the US Dollar. BNB rallied above $260 and might aim more upsides towards the $300 level. Binance coin price started a recovery wave from the $240 support against t...

BNB price (Binance coin) found support near $240 against the US Dollar. BNB rallied above $260 and might aim more upsides towards the $300 level.
- Binance coin price started a recovery wave from the $240 support against the US Dollar.
- The price is now trading above $265 and the 100 simple moving average (4-hours).
- There was a break above a major bearish trend line with resistance near $250 on the 4-hours chart of the BNB/USD pair (data source from Binance).
- The pair could is rising and might climb further above the $280 resistance zone.
This past week, BNB price formed a support base above the $240 level. There was a strong recovery wave started above the $250 resistance zone.
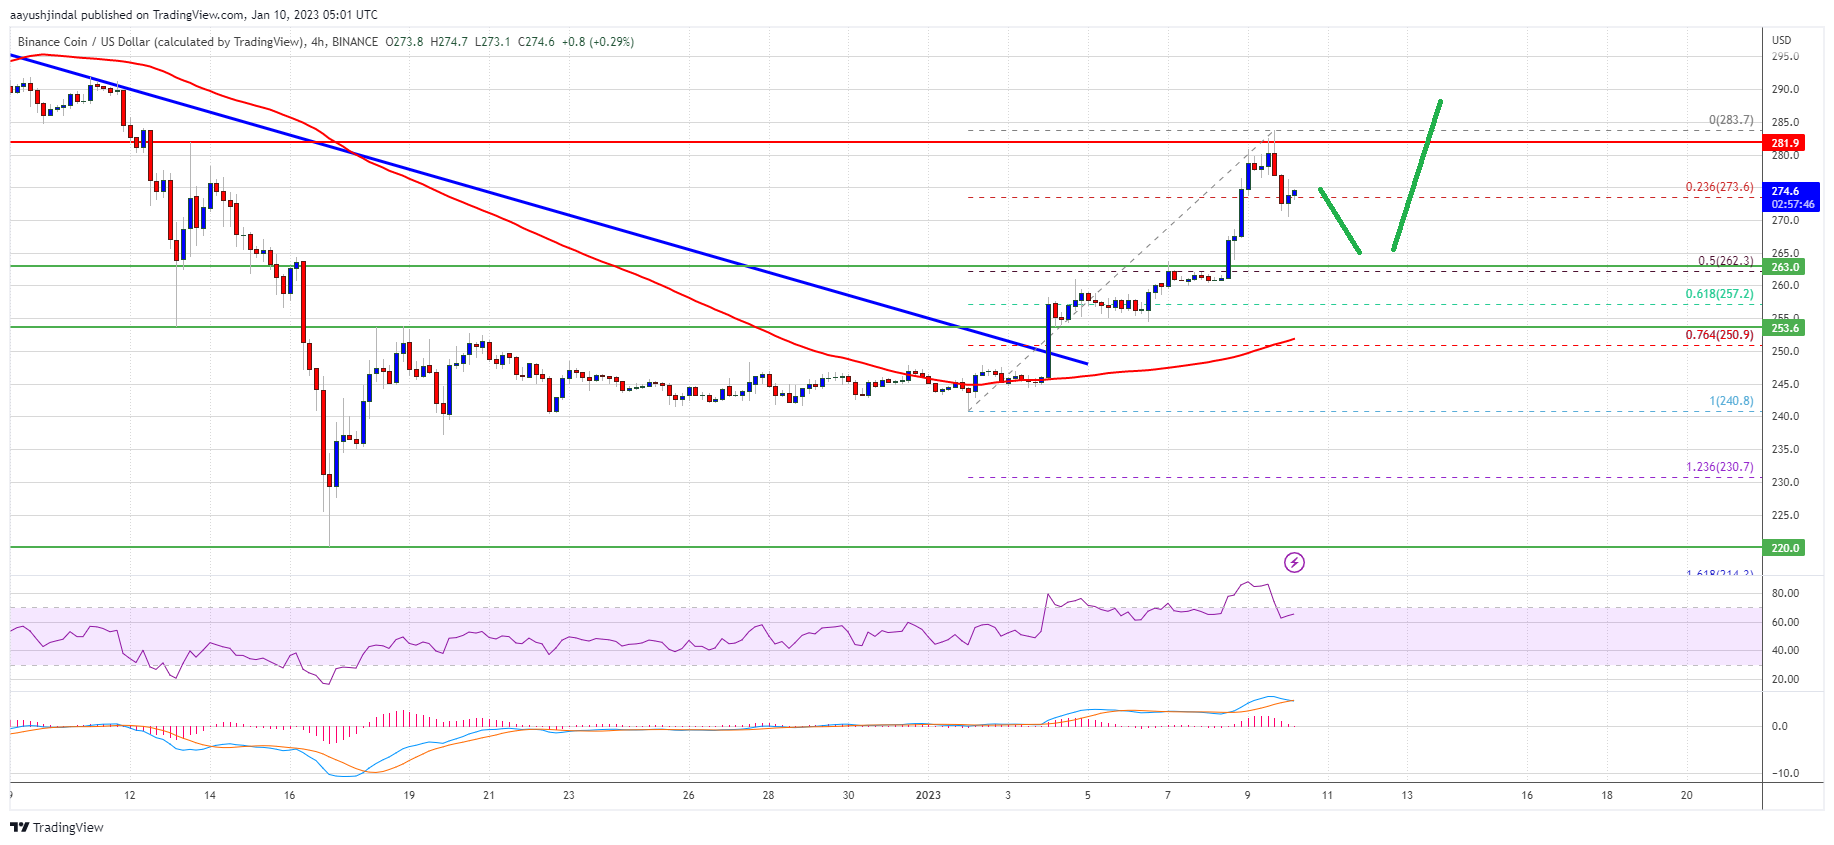
There was a break above a major bearish trend line with resistance near $250 on the 4-hours chart of the BNB/USD pair. The pair gained pace above the $255 and $260 resistance levels. Yesterday, there was a push above the $270 resistance zone, similar to bitcoin and ethereum.
BNB traded as high as $283 and is currently consolidating gains. It is now trading above $265 and the 100 simple moving average (4-hours). It is also near the 23.6% Fib retracement level of the upward move from the $240 swing low to $283 high.
Source: BNBUSD on TradingView.com
On the upside, the bears are protecting the $280 and $285 resistance levels. The next major resistance is near the $292 level, above which the price is likely to aim a test of the $300 level in the near term. Any more gains might send the price towards the $320 level.
Dips Supported in BNB?If BNB fails to clear the $280 resistance, it could start a downside correction. An initial support on the downside is near the $265 level.
The first major support is near the $262 level. It is near the 50% Fib retracement level of the upward move from the $240 swing low to $283 high. The next major support is near the $255 level. If there is a downside break below the $255 support, there could be an extended decline towards the $240 support.
Technical Indicators
4-Hours MACD – The MACD for BNB/USD is gaining pace in the bullish zone.
4-Hours RSI (Relative Strength Index) – The RSI for BNB/USD is currently above the 50 level.
Major Support Levels – $265, $262 and $255.
Major Resistance Levels – $280, $285 and $300.
Original source
Read on NewsBTCRelated market context

Uranium Holds Above $85 as Mining ETF Rebounds From June Sell-Off
The latest charts display that the market is divided into stable physical prices and uranium shares trying to regain momentum afte...

Bitcoin price challenges $64,000 weekend wall – needing a breakout or risk a deeper correction
Bitcoin reclaimed $64,000 on June 12 and touched an intraday high of $64,301 in the same session that spot ETF flows finally flipp...

Standard Chartered Says Bitcoin Bottomed Near $59,000 As Crypto Winter Ends
TL;DR Standard Chartered’s Geoffrey Kendrick reportedly says Bitcoin’s $59,000 area marked the cycle bottom. The note cites SpaceX...

Tether USDT Briefly Overtakes Ethereum in Market Cap: A $187B Wake-Up Call
For a few hours, earlier this week, Tether USDT stablecoin held a higher market cap than Ethereum, the first time that has happene...

SpaceX-linked products see $9B in trading, $5.6B on Binance in 24 hours
The surge in SpaceX-linked crypto trading highlights the growing role of digital assets as a parallel financial market, influencin...

Bitcoin rises above $64,000 after Pakistan prime minister says Iran peace deal is near
Bitcoin traded above $64,000 on Saturday, supported by its strongest ETF inflows in a month and growing optimism around geopolitic...