BNB Price Increase To Continue? This Resistance Could Trigger Fresh Rally
BNB price is attempting a fresh increase from the $288 zone. The price could start a fresh rally if there is a clear move above the $310 resistance. BNB price is showing bullish signs above the $300 pivot level. The pric...

BNB price is attempting a fresh increase from the $288 zone. The price could start a fresh rally if there is a clear move above the $310 resistance.
- BNB price is showing bullish signs above the $300 pivot level.
- The price is now trading below $310 and the 100 simple moving average (4 hours).
- There is a key bearish trend line forming with resistance near $306 on the 4-hour chart of the BNB/USD pair (data source from Binance).
- The pair gather bullish momentum if there is a close above the $308-$310 resistance zone.
In the past few days, BNB price started a decent increase and cleared the $300 resistance zone, unlike Bitcoin and Ethereum. There was a move above the $305 level before the bears appeared.
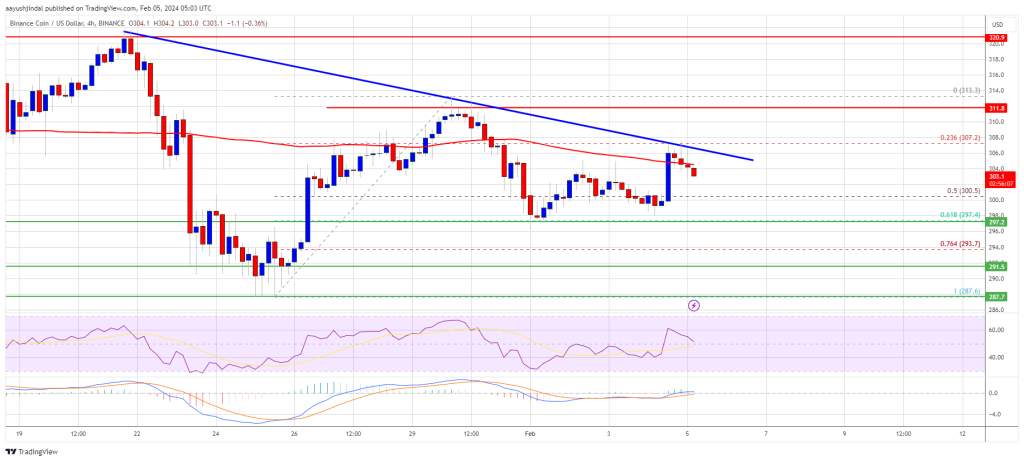
A high was formed near $313 and the price recently started a downside correction. There was a move below the $308 level. The price declined below the 50% Fib retracement level of the upward move from the $287 swing low to the $313 high.
BNB is now consolidating near $305 and the 100 simple moving average (4 hours). Immediate resistance is near the $308 level. There is also a key bearish trend line forming with resistance near $306 on the 4-hour chart of the BNB/USD pair.
Source: BNBUSD on TradingView.com
The next resistance sits near the $310 level. A clear move above the $310 zone could send the price further higher. In the stated case, BNB price could test $320. A close above the $320 resistance might set the pace for a larger increase toward the $335 resistance. Any more gains might call for a test of the $350 level.
Another Decline?If BNB fails to clear the $310 resistance, it could continue to move down. Initial support on the downside is near the $300 level. The next major support is near the $292 level or the 76.4% Fib retracement level of the upward move from the $287 swing low to the $313 high.
The main support sits at $288. If there is a downside break below the $288 support, the price could drop toward the $275 support. Any more losses could initiate a larger decline toward the $262 level.
Technical Indicators
4-Hours MACD – The MACD for BNB/USD is losing pace in the bullish zone.
4-Hours RSI (Relative Strength Index) – The RSI for BNB/USD is currently above the 50 level.
Major Support Levels – $300, $292, and $288.
Major Resistance Levels – $308, $310, and $320.
Original source
Read on NewsBTCRelated market context

Bitcoin Stabilizes Near Key Zone, But Glassnode Warns Capital Flows Remain Weak
Bitcoin’s rebound from the $60,000 area has given bulls something to work with, but Glassnode’s latest market read suggests the re...

BTC News Today: Bitcoin Climbs Toward $66K as Trump Reveals US-Iran Peace Deal
The renewed geopolitical optimism helped improve risk sentiment across financial markets, pushing Bitcoin back toward the $66,000...

Bitcoin Price and Crypto Stocks Surge as Iran Ceasefire, Strategy’s $100M Buy Collide With Fed Week
Bitcoin Magazine Bitcoin Price and Crypto Stocks Surge as Iran Ceasefire, Strategy’s $100M Buy Collide With Fed Week Bitcoin price...

Ethereum Research Proposal Targets Post-Quantum Wallet Security At Low Gas Cost
A new Ethereum Research proposal is putting post-quantum wallet security back in focus, outlining a practical way to verify quantu...

XRP Price Prediction: Ripple Jumps 10% as Crypto Total Market Cap Closing $2.4T
XRP price is moving again, and this time, prediction and volume back it up. The token has run 10% in the past 24 hours, pushing th...

XRP Price Prediction: US-Iran Peace Deal Fuels 13% XRP Surge, Analysts Target $1.94 Retest
The latest move saw XRP price today reclaim the $1.28 level for the first time in nearly two weeks. Market participants pointed to...