BNB Price Lacks Momentum Above $335 But Dips Likely To Be Limited
BNB price (Binance coin) faced a major resistance near $345 against the US Dollar. It is now testing key support at $325, below which it might dive to $315. Binance coin price is slowly moving lower from the $345 resista...
Archive context
Older archive item. Useful for background and entity history, but not a fresh market-moving signal.

BNB price (Binance coin) faced a major resistance near $345 against the US Dollar. It is now testing key support at $325, below which it might dive to $315.
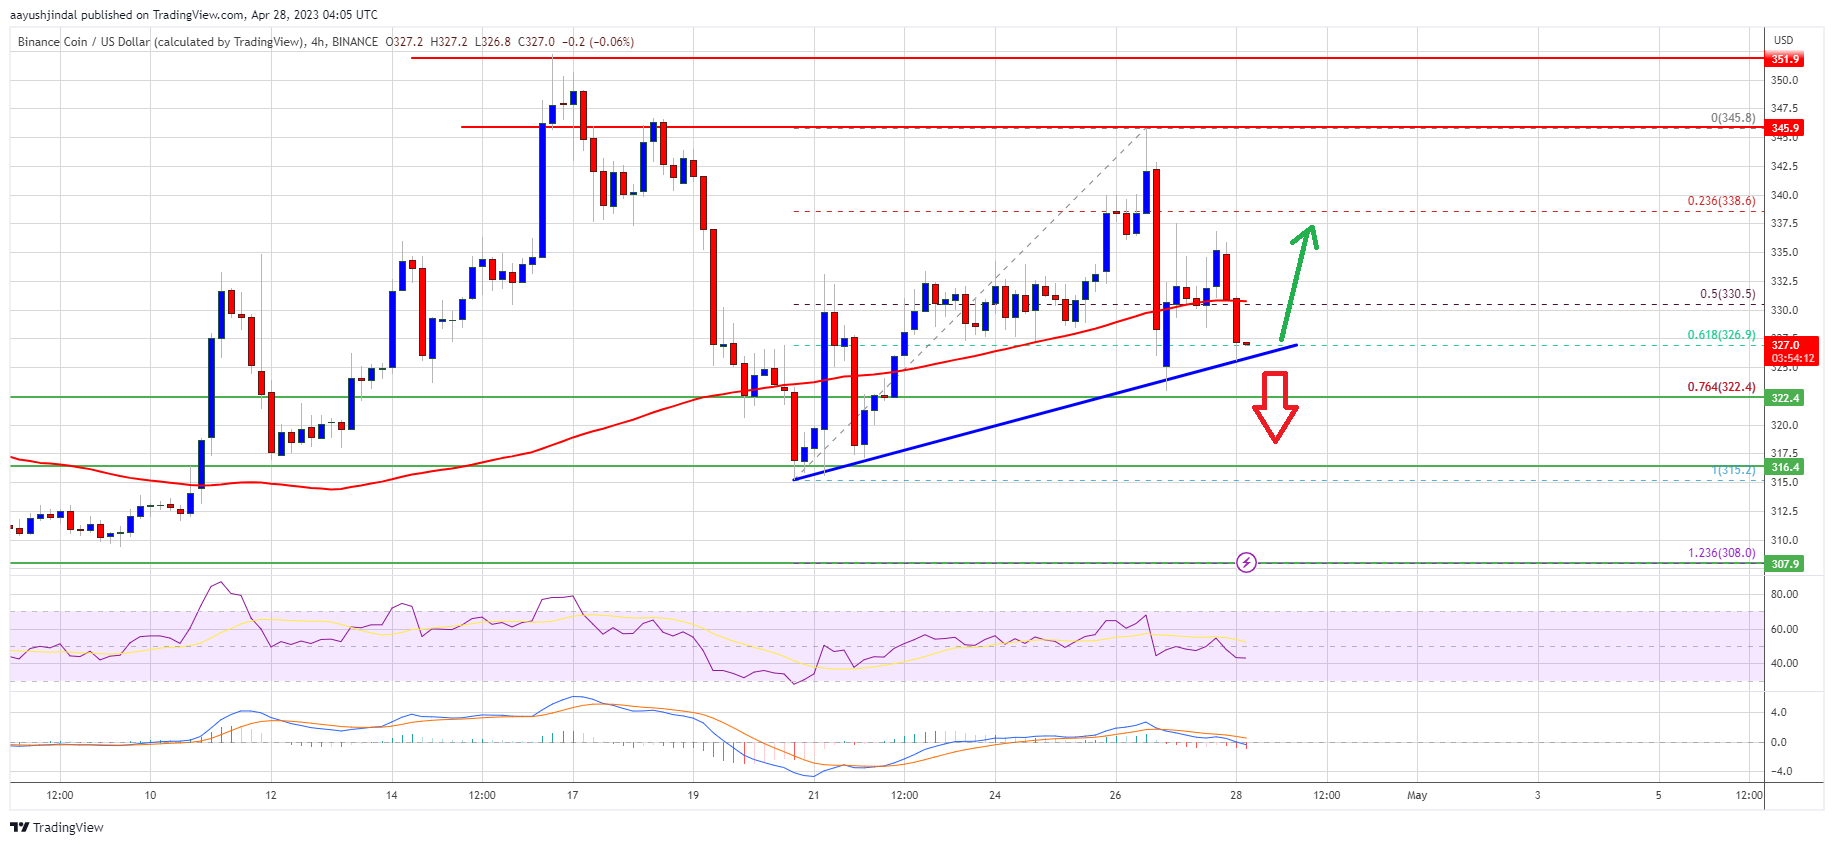
- Binance coin price is slowly moving lower from the $345 resistance against the US Dollar.
- The price is now trading below $330 and the 100 simple moving average (4 hours).
- There is a key bullish trend line forming with support near $325 on the 4-hour chart of the BNB/USD pair (data source from Binance).
- The pair could start a fresh increase if it stays above $325.
This past week, BNB price saw a decent increase above the $325 level, similar to Bitcoin and Ethereum. The bulls were able to push the price above the $335 and $340 levels.
However, the price faced strong resistance near the $345 level. A high was formed near $345 and the price started a steady decline. There was a move below the $340 and $335 support levels. The bears pushed the price below the 50% Fib retracement level of the upward move from the $315 swing low to the $345 high.
It is now trading below $330 and the 100 simple moving average (4 hours). Besides, there is a key bullish trend line forming with support near $325 on the 4-hour chart of the BNB/USD pair.
Source: BNBUSD on TradingView.com
On the upside, BNB is facing resistance near the $330 level and the 100 simple moving average (4 hours). The next major resistance is near the $335 level. A clear move above the $335 resistance might spark bullish moves. The next major resistance is near the $345 level, above which the price might rise toward the $350 resistance. Any more gains might send the price toward the $365 level.
More Losses in BNB?If BNB fails to clear the $330 resistance, it could continue to move down. Initial support on the downside is near the $325 level or the trend line.
The next major support is near the $322 level. If there is a downside break below the $322 support, there could be an extended decline toward the $315 support.
Technical Indicators
4-Hours MACD – The MACD for BNB/USD is gaining pace in the bearish zone.
4-Hours RSI (Relative Strength Index) – The RSI for BNB/USD is currently below the 50 level.
Major Support Levels – $325, $322, and $315.
Major Resistance Levels – $330, $335, and $345.
Why this matters
This altcoin story adds another data point to the current market tape and is useful when read alongside nearby source coverage.
Original source
Read on NewsBTCRelated market context

Bitcoin (BTC) Price Prediction: BTC Holds $63K Support—Can Rising Active Addresses Offset Bearish Technical Signals?
Although the BTC price has remained near a key support zone, recent chart signals and Strategy’s sale of a portion of its Bitcoin...

SEC Closes Consensys Ethereum 2.0 Probe, Removing A Major Staking Overhang
Ethereum has one less regulatory cloud hanging over it after Consensys said the U.S. Securities and Exchange Commission has closed...

Vitalik Buterin Says Ethereum’s Next Major Upgrade Will Take Three to Four Years and Rival the Merge
Ethereum co-founder Vitalik Buterin says the network’s next major overhaul, an initiative researchers are calling “Lean Ethereum,”...

Ethereum Price Prediction: Vitalik Hints at 3-4 Years Long ETH Rebuild
Ethereum price is trading at $1,780 as Vitalik Buterin revealed the network’s biggest roadmap since the Merge, which somehow sends...

Bitcoin Price Prediction: Peter Brandt Might Dump BTC for Gold
Bitcoin is facing a test, and its price prediction is not helping. So far in 2026, BTC has fallen about 28%, while gold is down ju...

Binance XRP scarcity index reaches highest level since mid-2024
XRP's scarcity on Binance could lead to increased price volatility, impacting traders and market dynamics as liquidity tightens. T...