BNB Price May Have Another Chance For A Bullish Streak: Here’s How
BNB price is attempting a fresh increase from the $515 zone. The price could gain bullish momentum if it clears the $572 resistance zone. BNB price started a fresh increase after it found support near the $515 zone. The...

BNB price is attempting a fresh increase from the $515 zone. The price could gain bullish momentum if it clears the $572 resistance zone.
- BNB price started a fresh increase after it found support near the $515 zone.
- The price is now trading below $555 and the 100 simple moving average (4 hours).
- There was a break above a key bearish trend line with resistance at $540 on the 4-hour chart of the BNB/USD pair (data source from Binance).
- The pair could gain bullish momentum if it clears the $572 resistance zone.
After a downside correction below $550, BNB price found support near the $515 zone. A low was formed at $513.6 and the price started a recovery wave, like Ethereum and Bitcoin.
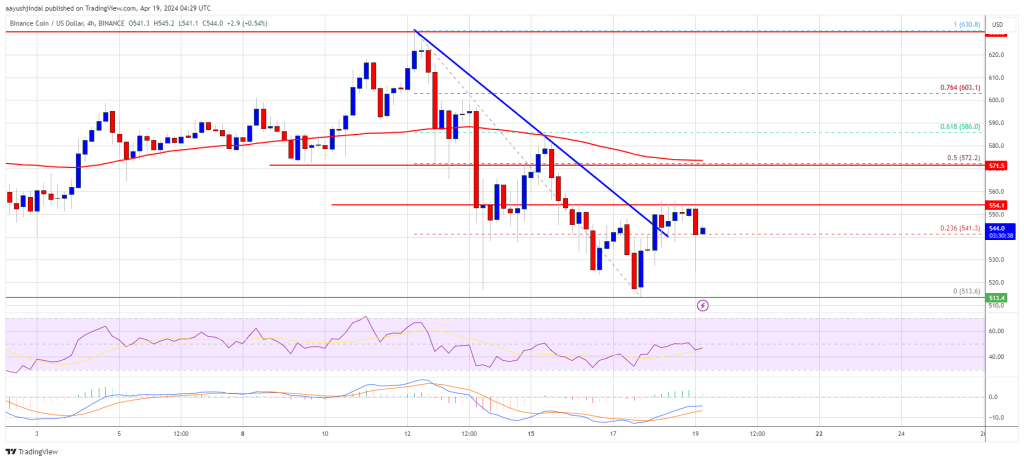
There was a move above the $525 and $530 resistance levels. The bulls pushed the price above the $540 pivot level and the 23.6% Fib retracement level of the downward move from the $630 swing high to the $513 low. There was also a break above a key bearish trend line with resistance at $540 on the 4-hour chart of the BNB/USD pair.
The price is still trading below $550 and the 100 simple moving average (4 hours). Immediate resistance is near the $555 level. The next resistance sits near the $572 level or the 50% Fib retracement level of the downward move from the $630 swing high to the $513 low.
Source: BNBUSD on TradingView.com
A clear move above the $572 zone could send the price further higher. In the stated case, BNB price could test $600. A close above the $600 resistance might set the pace for a larger increase toward the $630 resistance. Any more gains might call for a test of the $650 level in the coming days.
Another Decline?If BNB fails to clear the $572 resistance, it could start another decline. Initial support on the downside is near the $532 level.
The next major support is near the $520 level. The main support sits at $515. If there is a downside break below the $515 support, the price could drop toward the $500 support. Any more losses could initiate a larger decline toward the $465 level.
Technical Indicators
4-Hours MACD – The MACD for BNB/USD is losing pace in the bullish zone.
4-Hours RSI (Relative Strength Index) – The RSI for BNB/USD is currently below the 50 level.
Major Support Levels – $532, $520, and $515.
Major Resistance Levels – $555, $572, and $600.
Original source
Read on NewsBTCRelated market context

Bitcoin Stabilizes Near Key Zone, But Glassnode Warns Capital Flows Remain Weak
Bitcoin’s rebound from the $60,000 area has given bulls something to work with, but Glassnode’s latest market read suggests the re...

BTC News Today: Bitcoin Climbs Toward $66K as Trump Reveals US-Iran Peace Deal
The renewed geopolitical optimism helped improve risk sentiment across financial markets, pushing Bitcoin back toward the $66,000...

XRP Price Analysis: Ripple Token Eyes 10% Gain with Flashing Bullish Pattern and ETF Inflows
XRP price posts 9% moves today from low $1.1 to $1.24, with a prediction that it could go even higher. Two independent tailwinds a...

XRP Price Prediction: Ripple Jumps 10% as Crypto Total Market Cap Closing $2.4T
XRP price is moving again, and this time, prediction and volume back it up. The token has run 10% in the past 24 hours, pushing th...

XRP Price Prediction: US-Iran Peace Deal Fuels 13% XRP Surge, Analysts Target $1.94 Retest
The latest move saw XRP price today reclaim the $1.28 level for the first time in nearly two weeks. Market participants pointed to...

Ethereum Research Proposal Targets Post-Quantum Wallet Security At Low Gas Cost
A new Ethereum Research proposal is putting post-quantum wallet security back in focus, outlining a practical way to verify quantu...