BNB Price Prediction – Bears Aim Nasty Drop Below $200, Here’s Why
BNB price (Binance coin) is still struggling to clear the $220 resistance against the US Dollar. The price could decline heavily below the $210 and $202 support levels. Binance coin price is slowly moving lower from the...
Archive context
Older archive item. Useful for background and entity history, but not a fresh market-moving signal.

BNB price (Binance coin) is still struggling to clear the $220 resistance against the US Dollar. The price could decline heavily below the $210 and $202 support levels.
- Binance coin price is slowly moving lower from the $220 resistance against the US Dollar.
- The price is now trading below $215 and the 100 simple moving average (4 hours).
- There was a break below a key bullish trend line with support near $214.5 on the 4-hour chart of the BNB/USD pair (data source from Binance).
- The pair might accelerate lower if it breaks the $210 support level.
This past week, BNB price attempted a recovery wave above the $210 level. The price was able to clear the $215 resistance zone. However, it failed to clear the $220 resistance.
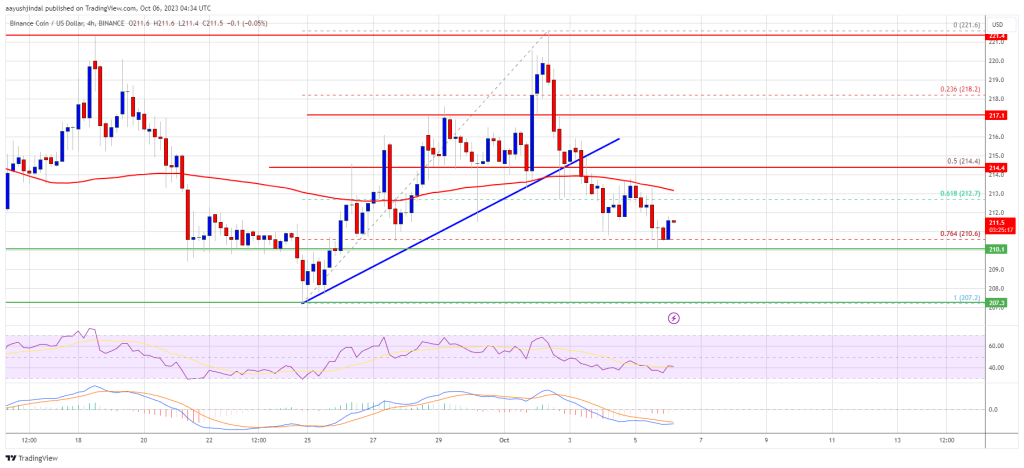
There was a fresh decline in BNB, like Bitcoin and Ethereum. The price declined below the $215 support level. The bears pushed the price below the 50% Fib retracement level of the upward move from the $207 swing low to the $221 high.
Besides, there was a break below a key bullish trend line with support near $214.5 on the 4-hour chart of the BNB/USD pair. The price is now trading below $215 and the 100 simple moving average (4 hours).
It is consolidating near the 76.4% Fib retracement level of the upward move from the $207 swing low to the $221 high. If there is a recovery wave, the price could face resistance near the $213 level and the 100 simple moving average (4 hours).
Source: BNBUSD on TradingView.com
The next resistance sits near the $215 level. A clear move above the $215 zone could send the price further higher. In the stated case, BNB price could test the main resistance at $220-$222. A close above the $222 resistance might set the pace for a larger increase toward the $250 resistance.
More Losses in BNB?If BNB fails to clear the $215 resistance, it could start another decline. Initial support on the downside is near the $210 level. The next major support is near the $207 level.
If there is a downside break below the $207 support, the price could drop toward the $202 support. Any more losses could initiate a larger decline toward the $165 level.
Technical Indicators
4-Hours MACD – The MACD for BNB/USD is gaining pace in the bearish zone.
4-Hours RSI (Relative Strength Index) – The RSI for BNB/USD is currently below the 50 level.
Major Support Levels – $210, $207, and $202.
Major Resistance Levels – $215, $220, and $222.
Why this matters
This altcoin story adds another data point to the current market tape and is useful when read alongside nearby source coverage.
Original source
Read on NewsBTCRelated market context

Solana Price Prediction: SOL Holds Near $81 as Breakout Setup Points to $87, but Whale Flows Keep Risk Active
Solana price is back in focus after a sharp recovery pushed SOL towards the $81 area. The move has improved short-term momentum, e...

Why Binance’s reported $2B Mesh investment could decide who controls stablecoin payments
Binance's reported move to lead a new Mesh funding round puts a strategic price on the payment routes stablecoins need to leave ex...

XRP vs Bitcoin: Investor Says RLUSD Growth and Regulatory Clarity Could Shift Crypto’s Balance of Power
While the claim remains highly ambitious given Bitcoin’s commanding lead in market capitalization, the discussion highlights broad...

JP Morgan Warns of New Bitcoin Sell Pressure From Strategy While XRP AI Transactions Approach 1 Million
Although the two developments are unrelated, they illustrate how Bitcoin’s institutional investment narrative and XRP’s expanding...

Bitcoin Price Prediction: Saylor’s Strategy is a Risk to Bitcoin, According to JP Morgan
JPMorgan has flagged a structural risk most Bitcoin price prediction bulls haven’t priced in: the same entity driving the most agg...

Hyperliquid (HYPE) Price Prediction: Symmetrical Triangle Breakout Puts $77 Target Back in Focus
The breakout comes after several sessions of price compression, with HYPE continuing to trade within a broader technical structure...