BNB Price Prediction: Strong Open Interest Fuels Bullish Outlook Near $875 Resistance
Market data and technical analysis indicate that traders increasingly expect a breakout, with the asset consolidating within a range that suggests growing pressure for an upward move. The convergence of rising open inter...
Archive context
Older archive item. Useful for background and entity history, but not a fresh market-moving signal.

Market data and technical analysis indicate that traders increasingly expect a breakout, with the asset consolidating within a range that suggests growing pressure for an upward move.
The convergence of rising open interest, robust market fundamentals, and classic chart patterns sets the stage for a potentially sustained rally.
Rising Open Interest Confirms Market ConfidenceAn open interest chart tracking BNB futures contracts highlights a significant increase in the number of open positions over recent months. This trend closely accompanies the coin’s price rally to near all-time highs, signaling that new capital is continuously flowing into the market.
The growing open interest serves as a bullish confirmation, reflecting that the price uptrend is supported by fresh leveraged positions and not merely driven by short-term speculation.
Source: Open Interest
Further analysis shows that despite price consolidation in the high-$800 range, open interest continues to rise. This divergence suggests that traders are building new positions in anticipation of a breakout, indicating market coiling and mounting pressure for a major price move.
In contrast, a simultaneous decline in both price and open interest would have implied trader exit or liquidation, signaling a loss of confidence. In this case, the sustained increase in open interest strengthens the outlook for continued upward momentum.
Market Data Supports Long-Term Bullish TrendOn one hand, BraveNewCoin’s comprehensive market data illustrates a long-term upward trajectory for BNB. The asset trades well above its 50-day and 200-day moving averages, with the 50-day MA positioned above the 200-day MA, forming a classic golden cross, a reliable indicator of long-term bullishness.
The recent all-time high near $900 is followed by natural consolidation, a common feature within strong bull markets.
Source: BraveNewCoin
Technical indicators on BraveNewCoin charts further reinforce this positive trend. The Relative Strength Index (RSI) remains in a neutral to mildly elevated range, suggesting that while the token is strong, it has not yet entered overbought territory, allowing room for further gains.
The Moving Average Convergence Divergence (MACD) maintains sustained positive momentum, with histogram bars above zero confirming ongoing bullish strength. These indicators define the $700 level as solid support, while $900 functions as critical resistance.
Chart Highlights Bullish Flag ConsolidationOn the other hand, TradingView’s detailed charting reveals BNB consolidating within a tight range between $850 support and $875 resistance, forming a classic bullish flag or pennant pattern.
This structure usually follows sharp price advances and signals a temporary pause before the trend resumes upward. The chart also identifies a rising trendline from recent lows that underpins this consolidation.
Source: TradingView
Short-term indicators provide insights into potential direction. The RSI hovers around the neutral 50 level, indicating a balance between buying and selling pressures.
The MACD shows a slight decline in bullish momentum, with converging lines that have not crossed into bearish territory, characteristic of consolidation phases. Trading volume declines during this period, consistent with the typical behavior of a bullish flag.
Why this matters
This altcoin story adds another data point to the current market tape and is useful when read alongside nearby source coverage.
Original source
Read on Brave New CoinRelated market context

RWA perpetuals open interest nears $20 billion, CryptoRank data shows
The surge in RWA perpetuals highlights a shift towards tokenized assets, potentially increasing institutional interest and diversi...

Elon Musk’s Grok AI Predicts When Bitcoin Will Finally Hit its Ultimate Price Target
X and SpaceX CEO Elon Musk’s Grok AI predicts something potentially historic could be brewing for Bitcoin by January 1, 2027. This...
Bitcoin Price Hovers Near $80,000 as Traders Await Fed Decision
Bitcoin Magazine Bitcoin Price Hovers Near $80,000 as Traders Await Fed Decision Bitcoin price traded near $80,000 on Monday, afte...
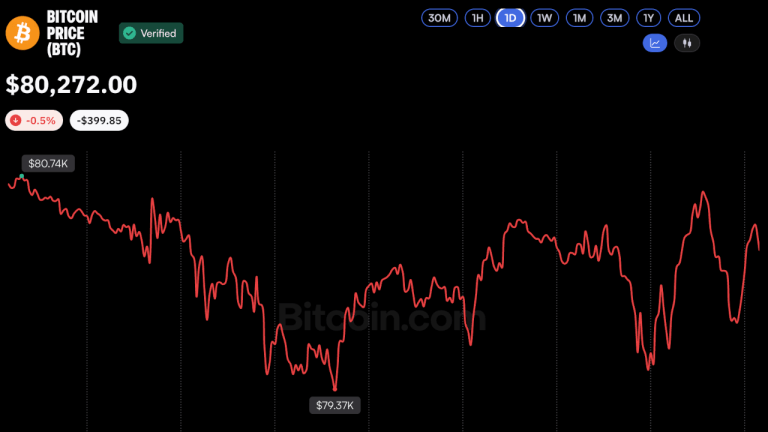
Bitcoin Price Struggles at $80K, but MEXC CEO Sees Bullish Signals
Bitcoin’s price reclaimed the $80,000 level twice on Monday, hovering near $80,100 amid rangebound trading between $79,500 and $80...

Robinhood Chain Nears $30B DEX Volume While $1.1B DeFi Base Fuels Fresh Tease
Key Takeaways: As reported by DefiLlama, Robinhood Chain has now surpassed $30 billion in 30-day decentralized exchange volume. DE...

The Bitcoin vs. Nasdaq Signal Has Flipped Bullish
▶Bitcoin Magazine The Bitcoin vs. Nasdaq Signal Has Flipped Bullish Tech stocks are selling off, and Bitcoin is holding. Today’s C...