BNB Price Prediction – Why Bulls Could Aim Fresh Rally To $350
BNB price is holding gains above the $300 pivot level. It is showing positive signs and might rally toward the $350 resistance zone. BNB price is moving higher above the $300 resistance. The price is now trading near $31...
Archive context
Older archive item. Useful for background and entity history, but not a fresh market-moving signal.

BNB price is holding gains above the $300 pivot level. It is showing positive signs and might rally toward the $350 resistance zone.
- BNB price is moving higher above the $300 resistance.
- The price is now trading near $310 and the 100 simple moving average (4 hours).
- There is a key declining channel or a bullish flag pattern forming with resistance near $325 on the 4-hour chart of the BNB/USD pair (data source from Binance).
- The pair might continue to move up if there is a clear move above $315 and $325
After a major increase, BNB price faced resistance near the $340 zone. The price started a downside correction and recently tested the $290 zone. A low was formed near $289, and the price is now attempting a fresh increase, like Bitcoin and Ethereum.
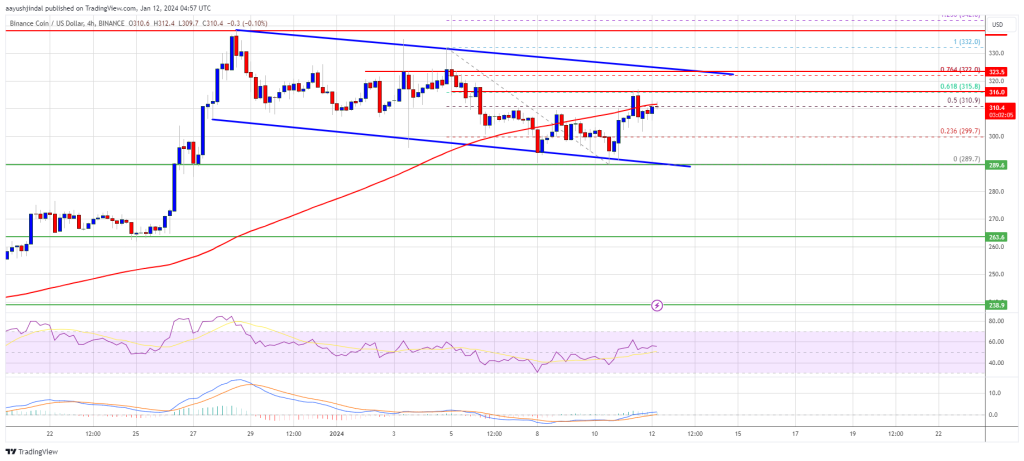
There was a move above the $295 and $300 levels. The bulls pushed the price above the 50% Fib retracement level of the downward move from the $332 swing high to the $289 low. BNB is now trading near $310 and the 100 simple moving average (4 hours).
The current price action is positive and signals more upsides. Immediate resistance is near the $315 level. It is close to the 61.8% Fib retracement level of the downward move from the $332 swing high to the $289 low.
The next resistance sits near the $322 level. There is also a key declining channel or a bullish flag pattern forming with resistance near $325 on the 4-hour chart of the BNB/USD pair. A clear move above the $225 zone could send the price further higher.
Source: BNBUSD on TradingView.com
In the stated case, BNB price could test $340. A close above the $340 resistance might set the pace for a larger increase toward the $350 resistance. Any more gains might call for a test of the $375 level.
Downside Correction?If BNB fails to clear the $322 resistance, it could start a downside correction. Initial support on the downside is near the $300 level.
The next major support is near the $292 level. The main support sits at $288. If there is a downside break below the $288 support, the price could drop toward the $262 support. Any more losses could initiate a larger decline toward the $250 level.
Technical Indicators
4-Hours MACD – The MACD for BNB/USD is gaining pace in the bullish zone.
4-Hours RSI (Relative Strength Index) – The RSI for BNB/USD is currently above the 50 level.
Major Support Levels – $300, $292, and $288.
Major Resistance Levels – $315, $322, and $325.
Why this matters
This altcoin story adds another data point to the current market tape and is useful when read alongside nearby source coverage.
Original source
Read on NewsBTCRelated market context

Bitcoin (BTC) Price Prediction: BTC Turns $79K into Support as Risk-On Signal Points to Fresh Rally Toward $100K
The move has also coincided with a shift in Glassnode’s Bitcoin Vector framework. The proprietary model moved into a Risk-On regim...

Hyperliquid (HYPE) Price Prediction: New ATH Near $90 and Whale Accumulation Strengthen $100 Breakout Outlook
Hyperliquid reached roughly $89.60 on September 6, according to exchange market data, while its 24-hour volume remained above $1 b...

Wall Street just poured nearly $900 million into Bitcoin and Ethereum ETFs
Bitcoin and Ethereum exchange-traded funds (ETFs) drew nearly $900 million as both cryptocurrencies pushed through closely watched...

ZEC Hits $1,025 ATH After 6,300% Surge From 2024 Lows as BTC Awaits $80K Breakout
The move marks a sharp reversal for ZEC from the deep drawdown that followed its 2018 peak and represents a gain of roughly 6,300%...

Inflation odds move toward 100% on Polymarket as traders brace for Fed rate hikes
Persistent inflation above 3% could lead to tighter monetary policy, impacting bond yields and growth stocks, while energy prices...

XRP Price Prediction: Spot Trading Volume Hits Highest in 6 Months
XRP price is trading around the $1.40 to $1.45 area after a sharp rebound pushed the token back toward $1.50 in a bullish predicti...