BNB Price Recovery in Limbo: Potential Cap Looms Amid Market Uncertainties
BNB price is showing bearish signs below the $600 level. The price must settle above the $575 and $585 resistance levels to gain bullish momentum. BNB price started a fresh decline after it failed to clear the $600 resis...

BNB price is showing bearish signs below the $600 level. The price must settle above the $575 and $585 resistance levels to gain bullish momentum.
- BNB price started a fresh decline after it failed to clear the $600 resistance zone.
- The price is now trading below $585 and the 100 simple moving average (4 hours).
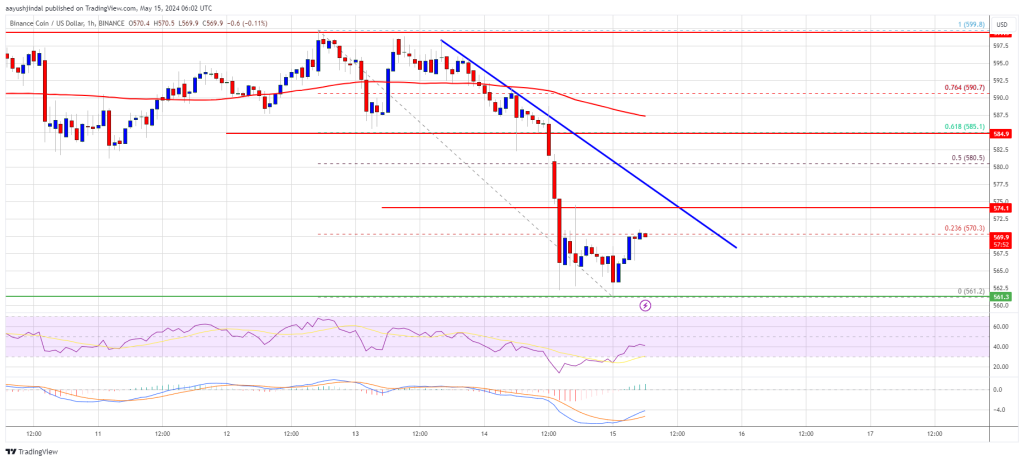
- There is a key bearish trend line forming with resistance near $575 on the hourly chart of the BNB/USD pair (data source from Binance).
- The pair could gain bullish momentum if it clears the $585 resistance zone.
After a decent increase, BNB price struggled near the $600 resistance. As a result, there was a bearish reaction below the $585 support, like Ethereum and Bitcoin.
The price dipped below the $575 support and the 100 simple moving average (4 hours). It traded as low as $561 and is currently consolidating losses. There was a minor upward move above the $565 level. The price tested the 23.6% Fib retracement level of the downward move from the $600 swing high to the $561 low.
It is now trading below $585 and the 100 simple moving average (4 hours). Immediate resistance is near the $575 level. There is also a key bearish trend line forming with resistance near $575 on the hourly chart of the BNB/USD pair.
The next resistance sits near the $585 level or the 61.8% Fib retracement level of the downward move from the $600 swing high to the $561 low. A clear move above the $585 zone could send the price higher.
In the stated case, BNB price could test $600. A close above the $600 resistance might set the pace for a larger increase toward the $650 resistance. Any more gains might call for a test of the $680 level in the coming days.
More Losses?If BNB fails to clear the $575 resistance, it could continue to move down. Initial support on the downside is near the $560 level.
The next major support is near the $550 level. The main support sits at $532. If there is a downside break below the $532 support, the price could drop toward the $510 support. Any more losses could initiate a larger decline toward the $500 level.
Technical Indicators
Hourly MACD – The MACD for BNB/USD is losing pace in the bearish zone.
Hourly RSI (Relative Strength Index) – The RSI for BNB/USD is currently below the 50 level.
Major Support Levels – $565, $550, and $532.
Major Resistance Levels – $575, $585, and $600.
Original source
Read on NewsBTCRelated market context

Ethereum Price Prediction: ETH is Still Below Its 200 Week SMA, and Tom Lee Buying Spree Might End Soon
Ethereum price is trading above $1,700 after running for 5% today, and even our prediction model is calling for more leg higher. H...

Bitcoin Stabilizes Near Key Zone, But Glassnode Warns Capital Flows Remain Weak
Bitcoin’s rebound from the $60,000 area has given bulls something to work with, but Glassnode’s latest market read suggests the re...

Ethereum News: Last Chance to Buy Ethereum Under $2K? ETH USD Powers Up After Hormuz Peace Deal
In the latest Ethereum News, Ethereum ETH Price is trading at $1,739 up 4% in 24 hours, as risk assets catch a bid following the H...

BTC News Today: Bitcoin Climbs Toward $66K as Trump Reveals US-Iran Peace Deal
The renewed geopolitical optimism helped improve risk sentiment across financial markets, pushing Bitcoin back toward the $66,000...

Bitcoin Price Prediction: Bank of Japan Rate Hike and Piling Yen Shorts Threaten BTC
Bitcoin price is back above $65,000, gaining more than $3,000 in a day, although Washington helps, news from the other side of the...

XRP Price Prediction: US-Iran Peace Deal Fuels 13% XRP Surge, Analysts Target $1.94 Retest
The latest move saw XRP price today reclaim the $1.28 level for the first time in nearly two weeks. Market participants pointed to...