BNB Price Regains Strength As The Bulls Aim For $650
BNB price is attempting a fresh increase from the $575 zone. The price is up over 5% and the bulls seem to be aiming for a move above $620. BNB price started a fresh increase after it found support near the $575 zone. Th...

BNB price is attempting a fresh increase from the $575 zone. The price is up over 5% and the bulls seem to be aiming for a move above $620.
- BNB price started a fresh increase after it found support near the $575 zone.
- The price is now trading above $600 and the 100 simple moving average (4 hours).
- There is a key bullish trend line forming with support at $587 on the 4-hour chart of the BNB/USD pair (data source from Binance).
- The pair could gain bullish momentum if it clears the $620 resistance zone.
After a downside correction below $600, BNB price found support near the $575 zone. A low was formed at $572.8 and the price started a fresh increase, unlike Ethereum and Bitcoin.
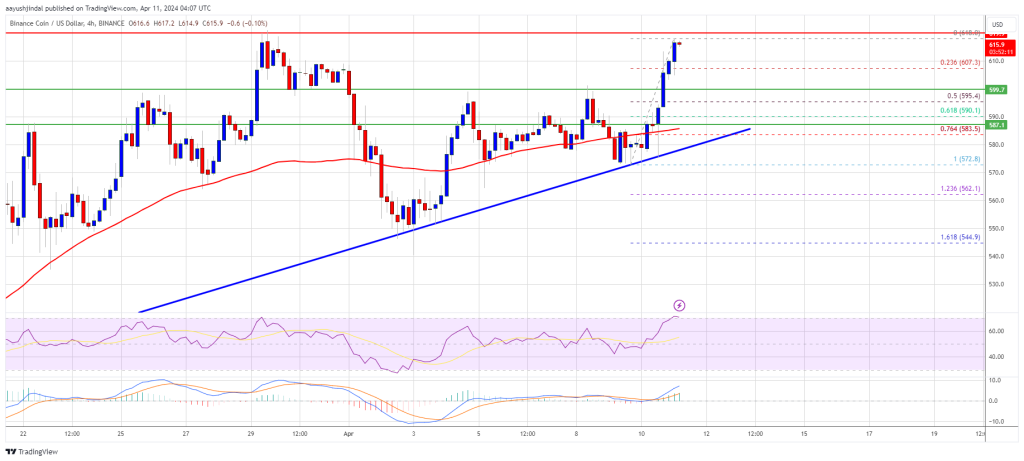
There was a move above the $595 and $600 resistance levels. The bulls pushed the price above the $605 pivot level. It is up over 5% and showing many positive signs above the 23.6% Fib retracement level of the recent increase from the $572.8 swing low to the $618.0 high.
The price is now trading above $600 and the 100 simple moving average (4 hours). There is also a key bullish trend line forming with support at $587 on the 4-hour chart of the BNB/USD pair.
Source: BNBUSD on TradingView.com
Immediate resistance is near the $618 level. The next resistance sits near the $620 level. A clear move above the $620 zone could send the price further higher. In the stated case, BNB price could test $632. A close above the $632 resistance might set the pace for a larger increase toward the $650 resistance. Any more gains might call for a test of the $700 level in the coming days.
Another Decline?If BNB fails to clear the $620 resistance, it could start a downside correction. Initial support on the downside is near the $600 level.
The next major support is near the $590 level and the trend line or the 61.8% Fib retracement level of the recent increase from the $572.8 swing low to the $618.0 high. The main support sits at $575. If there is a downside break below the $575 support, the price could drop toward the $562 support. Any more losses could initiate a larger decline toward the $550 level.
Technical Indicators
4-Hours MACD – The MACD for BNB/USD is gaining pace in the bullish zone.
4-Hours RSI (Relative Strength Index) – The RSI for BNB/USD is currently above the 50 level.
Major Support Levels – $600, $585, and $575.
Major Resistance Levels – $620, $632, and $650.
Original source
Read on NewsBTCRelated market context

Bitcoin Stabilizes Near Key Zone, But Glassnode Warns Capital Flows Remain Weak
Bitcoin’s rebound from the $60,000 area has given bulls something to work with, but Glassnode’s latest market read suggests the re...

BTC News Today: Bitcoin Climbs Toward $66K as Trump Reveals US-Iran Peace Deal
The renewed geopolitical optimism helped improve risk sentiment across financial markets, pushing Bitcoin back toward the $66,000...

XRP Price Analysis: Ripple Token Eyes 10% Gain with Flashing Bullish Pattern and ETF Inflows
XRP price posts 9% moves today from low $1.1 to $1.24, with a prediction that it could go even higher. Two independent tailwinds a...

Ethereum News: Last Chance to Buy Ethereum Under $2K? ETH USD Powers Up After Hormuz Peace Deal
In the latest Ethereum News, Ethereum ETH Price is trading at $1,739 up 4% in 24 hours, as risk assets catch a bid following the H...

Ethereum Price Prediction: ETH is Still Below Its 200 Week SMA, and Tom Lee Buying Spree Might End Soon
Ethereum price is trading above $1,700 after running for 5% today, and even our prediction model is calling for more leg higher. H...

Bitcoin Price and Crypto Stocks Surge as Iran Ceasefire, Strategy’s $100M Buy Collide With Fed Week
Bitcoin Magazine Bitcoin Price and Crypto Stocks Surge as Iran Ceasefire, Strategy’s $100M Buy Collide With Fed Week Bitcoin price...