BNB Price Signals Bullish Exhaustion, Are Dips Attractive In Short-term?
BNB price is struggling to clear the $320 resistance zone. It might decline toward the $288 support zone before the bulls aim for another increase. BNB price is struggling to gain traction above the $320 resistance. The...

BNB price is struggling to clear the $320 resistance zone. It might decline toward the $288 support zone before the bulls aim for another increase.
- BNB price is struggling to gain traction above the $320 resistance.
- The price is now trading near $310 and the 100 simple moving average (4 hours).
- There is a major declining channel or a bullish flag pattern forming with resistance near $316 on the 4-hour chart of the BNB/USD pair (data source from Binance).
- The pair might continue to move up if it stays above the $288 and $282 support levels.
After forming a base above the $280 level, BNB price started a decent increase. There was a move above the $305 and $315 resistance levels. However, the bears seem to be active near the $320 zone.
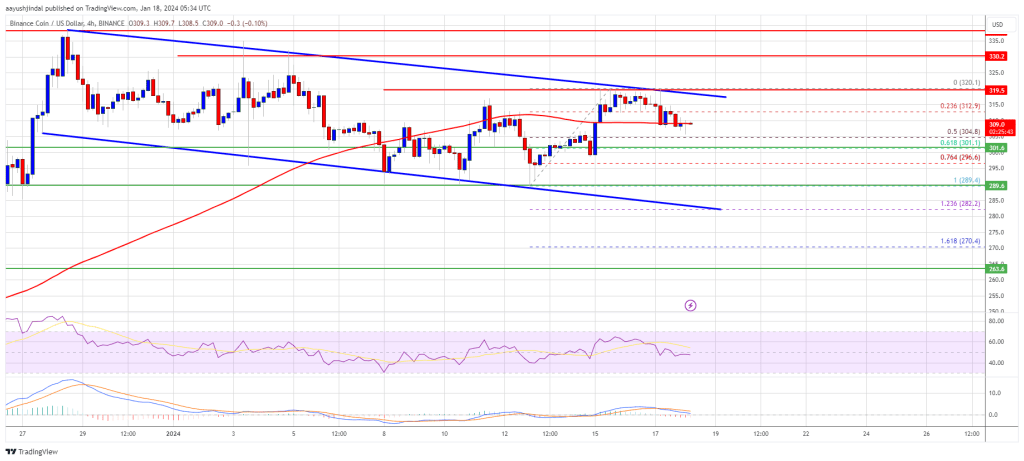
A high was formed near $320 and the price is now correcting gains. However, the downsides are limited compared to Bitcoin and Ethereum. There was a move below the $312 level. The price is now approaching the 50% Fib retracement level of the upward move from the $289.4 swing low to the $320.1 high.
BNB price is now trading near $310 and the 100 simple moving average (4 hours). There is also a major declining channel or a bullish flag pattern forming with resistance near $316 on the 4-hour chart of the BNB/USD pair.
Source: BNBUSD on TradingView.com
Immediate resistance is near the $315 level or the channel region. The next resistance sits near the $320 level. A clear move above the $320 zone could send the price further higher. In the stated case, BNB price could test $340. A close above the $340 resistance might set the pace for a larger increase toward the $350 resistance. Any more gains might call for a test of the $375 level.
More Downsides?If BNB fails to clear the $315 resistance, it could continue to move down. Initial support on the downside is near the $300 level or the 61.8% Fib retracement level of the upward move from the $289.4 swing low to the $320.1 high.
The next major support is near the $292 level. The main support sits at $288. If there is a downside break below the $288 support, the price could drop toward the $282 support. Any more losses could initiate a larger decline toward the $262 level.
Technical Indicators
4-Hours MACD – The MACD for BNB/USD is losing pace in the bullish zone.
4-Hours RSI (Relative Strength Index) – The RSI for BNB/USD is currently below the 50 level.
Major Support Levels – $300, $292, and $288.
Major Resistance Levels – $315, $320, and $325.
Original source
Read on NewsBTCRelated market context

BTC News Today: Bitcoin Climbs Toward $66K as Trump Reveals US-Iran Peace Deal
The renewed geopolitical optimism helped improve risk sentiment across financial markets, pushing Bitcoin back toward the $66,000...

Bitcoin Stabilizes Near Key Zone, But Glassnode Warns Capital Flows Remain Weak
Bitcoin’s rebound from the $60,000 area has given bulls something to work with, but Glassnode’s latest market read suggests the re...

XRP Price Prediction: US-Iran Peace Deal Fuels 13% XRP Surge, Analysts Target $1.94 Retest
The latest move saw XRP price today reclaim the $1.28 level for the first time in nearly two weeks. Market participants pointed to...

XRP Price Prediction: Ripple Jumps 10% as Crypto Total Market Cap Closing $2.4T
XRP price is moving again, and this time, prediction and volume back it up. The token has run 10% in the past 24 hours, pushing th...

Bitcoin’s Iran rally faces Japan rate test as it weighs 31-year high
Bitcoin's current relief rally is built on the back of the framework agreement between the US and Iran to halt their conflict and...

Lummis Links Bitcoin to $39.2T US Debt Crisis as CLARITY Act Nears Senate Floor
Senator Cynthia Lummis publicly tied Bitcoin to America’s $39.2 trillion national debt crisis on June 15, positioning the asset as...