BNB Price Surge Eyes $550 Breakout: Can It Push Higher?
BNB price started a fresh surge above the $525 resistance zone. The price is now consolidating gains and might aim for more gains above $550. BNB price started a fresh increase above the $525 resistance zone. The price i...

BNB price started a fresh surge above the $525 resistance zone. The price is now consolidating gains and might aim for more gains above $550.
- BNB price started a fresh increase above the $525 resistance zone.
- The price is now trading below $535 and the 100-hourly simple moving average.
- There is a short-term rising channel forming with support at $540 on the hourly chart of the BNB/USD pair (data source from Binance).
- The pair must stay above the $525 pivot level to start another increase in the near term.
In the last analysis, we discussed the chance of more gains in BNB price above the $525 resistance. The price outperformed Ethereum and Bitcoin. It surged above the $525 and $535 levels.
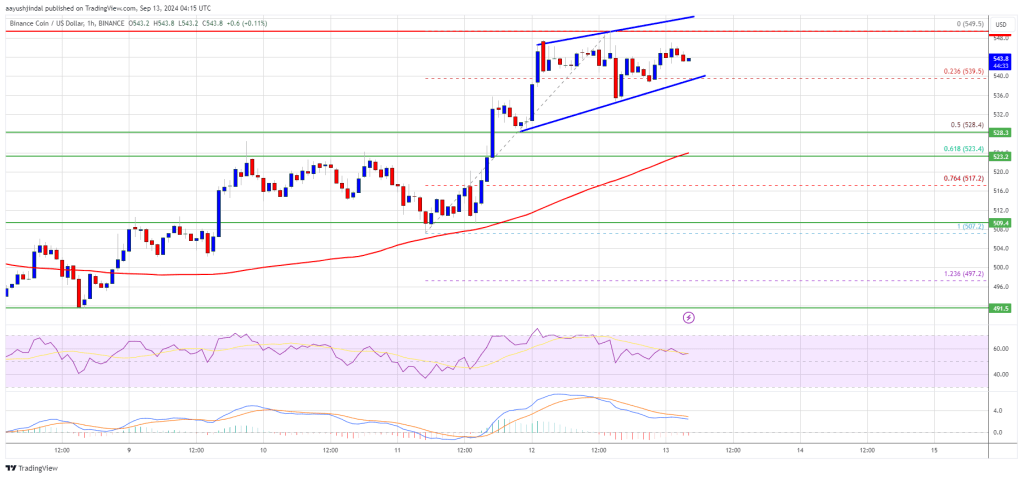
It even tested the $550 resistance zone. A high was formed at $549.5 and the price started a downside correction. There was a move below the $545 level. The price slipped just below the 23.6% Fib retracement level of the upward move from the $507 swing low to the $549 high.
The pair is now trading above $535 and the 100-hourly simple moving average. There is also a short-term rising channel forming with support at $540 on the hourly chart of the BNB/USD pair.
If there is a fresh increase, the price could face resistance near the $548 level. The next resistance sits near the $550 level. A clear move above the $550 zone could send the price higher. In the stated case, BNB price could test $562.
A close above the $562 resistance might set the pace for a larger move toward the $580 resistance. Any more gains might call for a test of the $585 level in the near term.
Are Dips Limited?If BNB fails to clear the $550 resistance, it could start another decline. Initial support on the downside is near the $540 level and the channel trend line. The next major support is near the $525 level or the 61.8% Fib retracement level of the upward move from the $507 swing low to the $549 high.
The main support sits at $520. If there is a downside break below the $520 support, the price could drop toward the $505 support. Any more losses could initiate a larger decline toward the $500 level.
Technical Indicators
Hourly MACD – The MACD for BNB/USD is losing pace in the bullish zone.
Hourly RSI (Relative Strength Index) – The RSI for BNB/USD is currently above the 50 level.
Major Support Levels – $540 and $525.
Major Resistance Levels – $548 and $550.
Original source
Read on NewsBTCRelated market context

Standard Chartered Says Bitcoin Bottomed Near $59,000 As Crypto Winter Ends
TL;DR Standard Chartered’s Geoffrey Kendrick reportedly says Bitcoin’s $59,000 area marked the cycle bottom. The note cites SpaceX...

Bitcoin price challenges $64,000 weekend wall – needing a breakout or risk a deeper correction
Bitcoin reclaimed $64,000 on June 12 and touched an intraday high of $64,301 in the same session that spot ETF flows finally flipp...

Are 24/7 CME Bitcoin futures a volatility cure — or a new leverage trap?
Wall Street got to trade Bitcoin around the clock just in time to watch the market fall apart. CME Group launched 24/7 trading for...

Tether USDT Briefly Overtakes Ethereum in Market Cap: A $187B Wake-Up Call
For a few hours, earlier this week, Tether USDT stablecoin held a higher market cap than Ethereum, the first time that has happene...

Google Gemini AI Predicts Jaw-Dropping XRP Price For Next 90 Days
Google Gemini AI just put XRP back under the spotlight, predicting it is tightly wound for a major breakout toward $1.60 to $1.80...

Bitcoin rises above $64,000 after Pakistan prime minister says Iran peace deal is near
Bitcoin traded above $64,000 on Saturday, supported by its strongest ETF inflows in a month and growing optimism around geopolitic...