BNB Uptrend Gears Up: 10% Jump Brings $724 Resistance Into Play
BNB is riding a strong bullish wave, surging over 10% as bullish momentum continues to build. This impressive rally has brought the price closer to the critical $724 resistance level, a key barrier that could dictate its...
Archive context
Older archive item. Useful for background and entity history, but not a fresh market-moving signal.

BNB is riding a strong bullish wave, surging over 10% as bullish momentum continues to build. This impressive rally has brought the price closer to the critical $724 resistance level, a key barrier that could dictate its next major move.
Over the past few days, BNB has displayed strong buying pressure, signaling renewed investor confidence. The surge comes amid broader market optimism, with bulls aiming to capitalize on the move. However, the $724 mark has historically been a tough zone, where sellers have previously stepped in to trigger corrections.
With market sentiment shifting in favor of altcoins, BNB’s performance is being closely watched. Will it conquer $724, or will resistance prove too strong? The coming days will be crucial in determining BNB’s next chapter.
Technical Analysis: Can BNB Break Through $724?BNB’s recent 10% surge has brought it closer to the critical and challenging $724 resistance level, and breaking through it would require substantial buying pressure. The cryptocurrency’s price is currently trading above the 100-day Simple Moving Average (SMA), indicating that bullish momentum remains intact. This technical indicator is often used to gauge the overall market trend, and trading above it suggests that buyers are in control and the uptrend could continue.
A sustained position above the 100-day SMA typically acts as a strong support level, preventing deeper pullbacks and reinforcing market confidence. If buying pressure remains steady, the price may continue its upward trajectory to key resistance levels.
However, the MACD indicator shows overbought conditions, signaling that the asset may be approaching a potential reversal or consolidation phase. When the MACD line moves significantly above the signal line and the histogram expands, it often suggests that upside pressure is losing steam, and a price correction could be on the horizon.
An overbought MACD reading does not necessarily mean an immediate downturn, but it does indicate that buyers may be exhausted and that profit-taking may increase. If the indicator starts to show a bearish crossover—where the MACD line crosses below the signal line—it would confirm a weakening trend, leading to a price retracement toward key support levels.
Market Outlook: What’s Next For The Price?The market outlook remains cautiously bullish, with technical indicators showing strong momentum. BNB is trading above key moving averages, reinforcing the uptrend, while trading volume remains high, signaling sustained investor interest. However, challenges remain, particularly with the MACD flashing overbought signals, causing the rally to lose steam.
Should BNB break and hold above $724, it might trigger a fresh wave of buying, pushing the price toward $795 and beyond. On the other hand, a rejection at this level is likely to spark a short-term pullback, with $680 and $605 acting as key support zones.
Why this matters
This altcoin story adds another data point to the current market tape and is useful when read alongside nearby source coverage.
Original source
Read on NewsBTCRelated market context

XRP Price Prediction: Ripple Faces Strongest Derivatives Selling Pressure
XRP price is having a more complicated prediction than that single red number suggests. Beneath the surface, derivatives desks are...

Dogecoin (DOGE) Price Prediction: DOGE Holds Near $0.084 as $0.09 Breakout Could Open $0.115
Dogecoin is back in the spotlight as price slips towards the $0.084 area, putting an important support zone under pressure. The la...

Sui (SUI) Price Prediction: ETF Inflows and 100MA Support Strengthen $1.15 Outlook
Recent SUI price action has focused attention on the $0.73-$0.76 area, where several short- and medium-term moving averages are pr...

Bitcoin’s failed $81,000 breakout just put $75,000 back on the table
Bitcoin trades near $78,000 heading into the weekend, sitting almost between $77,000 support and $80,000 resistance after a sharp...
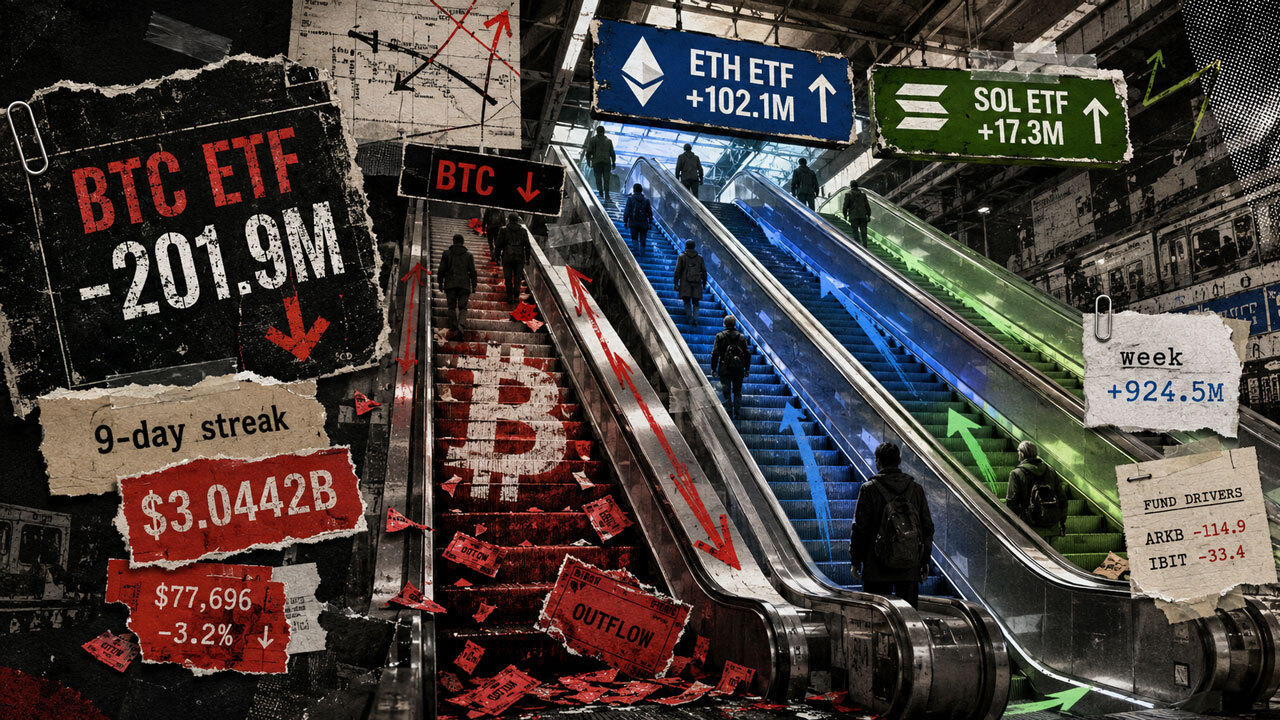
Bitcoin ETF inflows snap after $3 billion streak as ETH, XRP and Solana keep buying
US-listed Bitcoin exchange-traded funds (ETFs) lost $201.9 million Friday, ending a nine-day inflow streak as Ethereum, XRP and So...

XRP Price Prediction: Momentum and $1.40 Floor to Hold
XRP price trades around the $1.40 to $1.45 range, down from the recent $1.70 peak as the token digests one of its sharpest weekly...