Can Cardano (ADA) Bounce Back? A Closer Look at Its Recovery Potential
Cardano (ADA) corrected gains and tested the $0.4520 support zone. ADA must stay above the $0.450 support to start a fresh upward move. ADA price is struggling to gain bullish momentum above the $0.4750 zone. The price i...

Cardano (ADA) corrected gains and tested the $0.4520 support zone. ADA must stay above the $0.450 support to start a fresh upward move.
- ADA price is struggling to gain bullish momentum above the $0.4750 zone.
- The price is trading below $0.460 and the 100-hourly simple moving average.
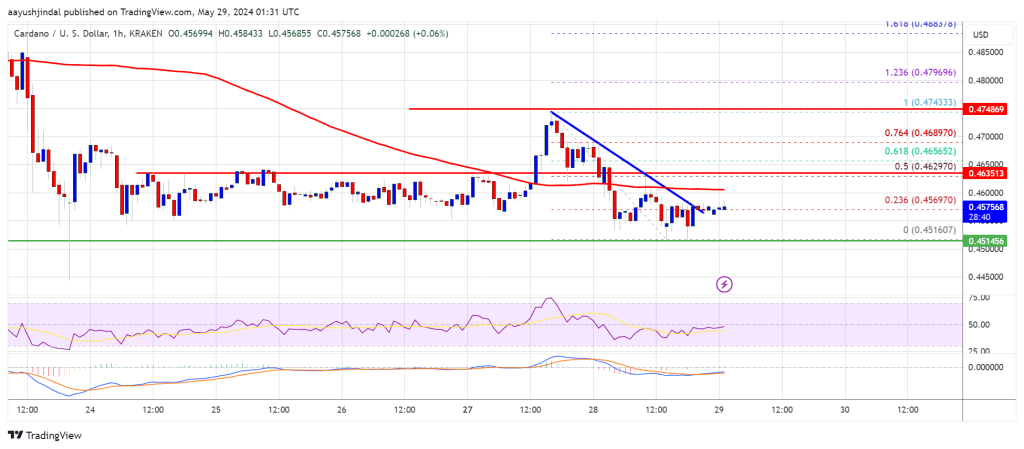
- There was a break above a connecting bearish trend line with resistance at $0.4570 on the hourly chart of the ADA/USD pair (data source from Kraken).
- The pair could gain bullish momentum if there is a close above $0.4620.
In the past few sessions, Cardano started a downward move after it failed to clear the $0.4750 resistance. ADA dipped below the $0.4620 support and tested the key support at $0.4520 like Bitcoin and Ethereum.
A low was formed at $0.4516 and the price is now consolidating losses. There was a minor recovery wave above the $0.4550 zone. There was a break above a connecting bearish trend line with resistance at $0.4570 on the hourly chart of the ADA/USD pair. The pair tested the 23.6% Fib retracement level of the recent decline from the $0.4743 swing high to the $0.4516 low.
Cardano is now trading below $0.4620 and the 100-hourly simple moving average. On the upside, immediate resistance is near the $0.4960 zone. The first resistance is near $0.4620 or the 50% Fib retracement level of the recent decline from the $0.4743 swing high to the $0.4516 low.
The next key resistance might be $0.4750. If there is a close above the $0.4750 resistance, the price could start a strong rally. In the stated case, the price could rise toward the $0.50 region. Any more gains might call for a move toward $0.5250.
More Losses in ADA?If Cardano’s price fails to climb above the $0.4620 resistance level, it could continue to move down. Immediate support on the downside is near the $0.4520 level.
The next major support is near the $0.4460 level. A downside break below the $0.4460 level could open the doors for a test of $0.4320. The next major support is near the $0.420 level.
Technical Indicators
Hourly MACD – The MACD for ADA/USD is losing momentum in the bearish zone.
Hourly RSI (Relative Strength Index) – The RSI for ADA/USD is now below the 50 level.
Major Support Levels – $0.4520, $0.4460, and $0.4320.
Major Resistance Levels – $0.4620 and $0.4750.
Original source
Read on NewsBTCRelated market context

Uranium Holds Above $85 as Mining ETF Rebounds From June Sell-Off
The latest charts display that the market is divided into stable physical prices and uranium shares trying to regain momentum afte...

Standard Chartered Says Bitcoin Bottomed Near $59,000 As Crypto Winter Ends
TL;DR Standard Chartered’s Geoffrey Kendrick reportedly says Bitcoin’s $59,000 area marked the cycle bottom. The note cites SpaceX...

Bitcoin price challenges $64,000 weekend wall – needing a breakout or risk a deeper correction
Bitcoin reclaimed $64,000 on June 12 and touched an intraday high of $64,301 in the same session that spot ETF flows finally flipp...

Bitcoin rises above $64,000 after Pakistan prime minister says Iran peace deal is near
Bitcoin traded above $64,000 on Saturday, supported by its strongest ETF inflows in a month and growing optimism around geopolitic...

Are 24/7 CME Bitcoin futures a volatility cure — or a new leverage trap?
Wall Street got to trade Bitcoin around the clock just in time to watch the market fall apart. CME Group launched 24/7 trading for...

US forces shoot down Iranian attack drones near Strait of Hormuz, Bitcoin drops below $73K
Geopolitical tensions near vital oil routes can destabilize financial markets, highlighting the interconnectedness of global secur...