Cardano (ADA) Continues To Sink, What’s Next For The Coin?
Cardano (ADA) recently fell below its support line of $0.50 as seen at press time. Just like Bitcoin, major altcoins too have either consolidated or fallen on their charts. On the longer time frame, Cardano (ADA) continu...
Archive context
Older archive item. Useful for background and entity history, but not a fresh market-moving signal.

Cardano (ADA) recently fell below its support line of $0.50 as seen at press time. Just like Bitcoin, major altcoins too have either consolidated or fallen on their charts. On the longer time frame, Cardano (ADA) continued to display bearish thesis.
For the shorter time frame, ADA was hinting at a possible price reversal on charts. Over the last 24 hours, ADA increased by 1.7% and in the last week, the coin brought home a double digit loss. The bulls have faded out as buying strength continued to remain bleak at the time of writing.
At the moment, $0.50 has been acting as the coin’s immediate resistance mark. Immediate support levels for the coin ranged between the $0.44 and $0.40 price marks respectively. If broader market recovers along with a consistent buying strength, there could be hopes of a price reversal for Cardano (ADA).
Cardano Price Analysis: One Day Chart Cardano was priced at $0.47 at on the four hour chart | Source: ADAUSD on TradingViewADA was trading at $0.47 at the time of writing. Ever since April the coin formed a descending channel which reflected bearishness on the chart. Recently, ADA broke out of the descending channel as it fell below the $0.50 price mark.
At the moment $0.50 is acting as the nearest price ceiling for the coin. In case Cardano is able to break past the $0,50 price mark, the coin could trade near $0.58. A fall below the $0.47 price level will cause ADA to hover between $0.44 and $0.40.
A fall beneath which might make ADA touch its over an year low price level. Volume of the coin dipped considerably signifying that bears were still in charge.
Technical Analysis Cardano registered an uptick in buying strength on the four hour chart | Source: ADAUSD on TradingViewCardano showed signs of price reversal on the four hour chart. The price of the altcoin was attempting to rise above the 20-SMA line. At the moment however, the sellers were still in charge of the price momentum.
The Relative Strength Index registered an uptick which meant that the price was optimistic on the chart. Buyers were coming back in the market and an increased demand could push the asset above the 20-SMA.
Increased demand will make ADA trade near the $0.58 price level and then the coin could attempt to touch the $0.70 price level.
Related Reading | Ethereum Profitability Dumps To 2-Year Low As Price Corrects Below $2,000
Cardano flashed buy signal on the four hour chart | Source: ADAUSD on TradingViewADA’s Awesome Oscillator displayed green histograms and this meant a change in price momentum. AO also depicted a buy signal as the green histograms were a sign of the same.
Moving Average Convergence Divergence underwent a bullish crossover and flashed green histograms.
Green histograms meant that over the upcoming trading sessions, the coin could attempt to rise on its charts.
Suggested Reading | Cardano TVL Sheds $205 Million Since Hitting All-Time High
Why this matters
This altcoin story adds another data point to the current market tape and is useful when read alongside nearby source coverage.
Original source
Read on NewsBTCRelated market context

Climate Change and Crypto: Ethiopia’s 75% Power Cut Tests Bitcoin Mining’s Green Pitch
In climate change crypto news, Bitcoin miners have spent years pitching hydropower as proof the network can run clean. Ethiopia ju...

Bitcoin Falls Below $76,000 as Traders Cut CLARITY Act Odds Hours Before Senate Vote
Bitcoin gave back Monday's advance through the overnight Asia and Europe sessions and fell further in the first 90 minutes of U.S....

Bitcoin (BTC) Price Today: Whale Selling and ETF Outflows Put $76K Support to the Test
The Bitcoin price remains within a broader range, however, with technical support between $76,000 and $77,500 continuing to attrac...
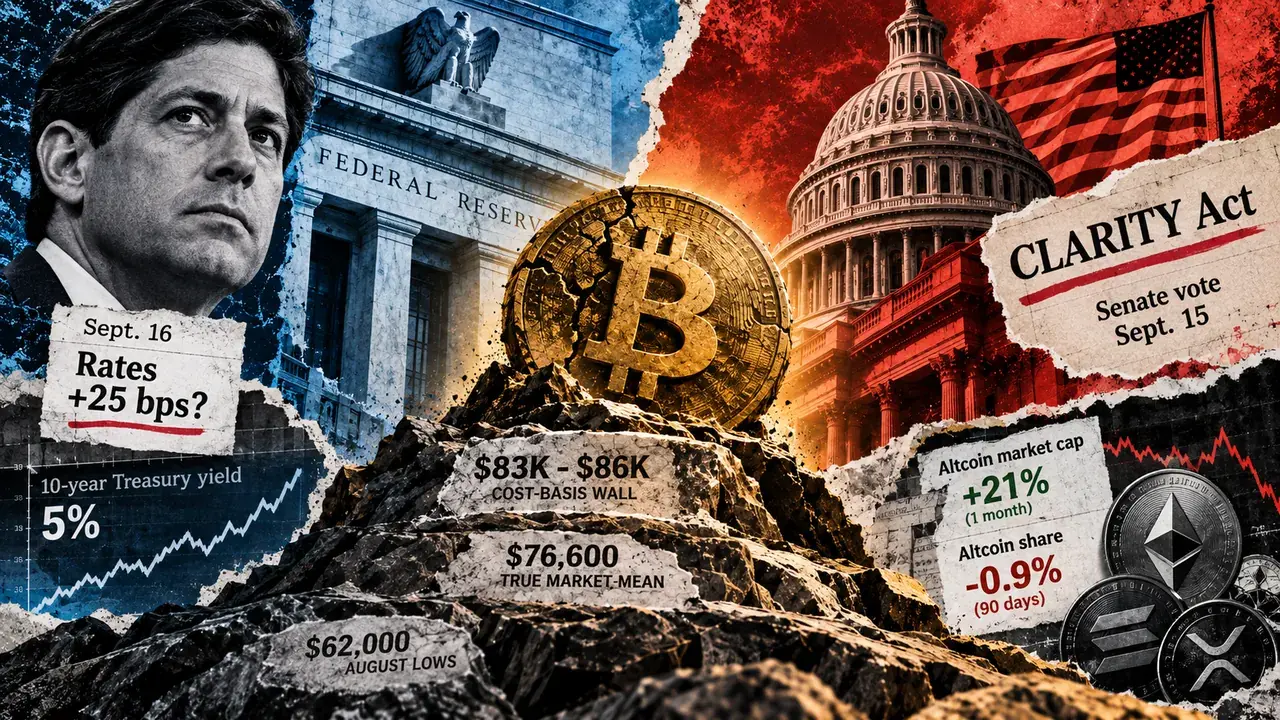
Altcoins gained 21% and still lost ground to Bitcoin. What would finally turn the tables?
Glassnode reported that altcoin market capitalization climbed 21% over the past month, while altcoins' share of the combined Bitco...

Bitcoin drops below $75,000, quickly rebounds above $76,000 as Fed rate hike fears rattle crypto
Market volatility highlights the sensitivity of cryptocurrencies to macroeconomic factors, underscoring the need for cautious inve...

Bitcoin’s realized cap rises for first time in 2026, ending 87-day decline
The rise in Bitcoin's realized cap suggests renewed investor confidence and potential market stabilization, signaling a shift in s...