Cardano (ADA) Falls: Ethereum’s Decline Pulls Altcoins Down
Cardano price started a fresh decline below the $0.4120 support. Ethereum’s decline seems to be dragging ADA lower toward the $0.380 support. ADA price started a fresh decline from the $0.450 resistance zone. The price i...

Cardano price started a fresh decline below the $0.4120 support. Ethereum’s decline seems to be dragging ADA lower toward the $0.380 support.
- ADA price started a fresh decline from the $0.450 resistance zone.
- The price is trading below $0.4120 and the 100-hourly simple moving average.
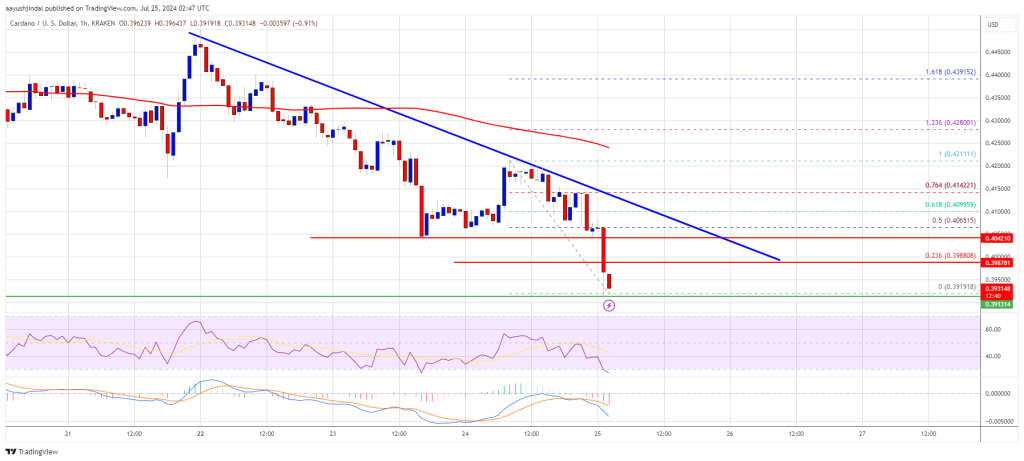
- There is a key bearish trend line forming with resistance at $0.4060 on the hourly chart of the ADA/USD pair (data source from Kraken).
- The pair could continue to move down and test the $0.380 support zone.
After a steady increase, Cardano faced sellers near the $0.450 resistance zone. ADA formed a short-term top and started a pullback below the $0.4250 level. Recently, Ethereum’s decline dragged it further lower below the $0.400 support.
A low is formed near $0.3919 and the price is consolidating losses with a bearish angle. There is also a key bearish trend line forming with resistance at $0.4060 on the hourly chart of the ADA/USD pair.
Cardano price is now trading below $0.4100 and the 100-hourly simple moving average. If there is a recovery wave, the price might face resistance near the $0.4050 zone and the 50% Fib retracement level of the downward move from the $0.4211 swing high to the $0.3919 low.
The first resistance is near $0.4150 or the 76.4% Fib retracement level of the downward move from the $0.4211 swing high to the $0.3919 low. The next key resistance might be $0.4220. If there is a close above the $0.4220 resistance, the price could start a strong rally. In the stated case, the price could rise toward the $0.4450 region. Any more gains might call for a move toward $0.4500.
More Downsides in ADA?If Cardano’s price fails to climb above the $0.4050 resistance level, it could continue to move down. Immediate support on the downside is near the $0.3920 level.
The next major support is near the $0.3800 level. A downside break below the $0.3800 level could open the doors for a test of $0.3650. The next major support is near the $0.3500 level where the bulls might emerge.
Technical Indicators
Hourly MACD – The MACD for ADA/USD is gaining momentum in the bearish zone.
Hourly RSI (Relative Strength Index) – The RSI for ADA/USD is now below the 50 level.
Major Support Levels – $0.3920 and $0.3800.
Major Resistance Levels – $0.4050 and $0.4150.
Original source
Read on NewsBTCRelated market context

Standard Chartered Says Bitcoin Bottomed Near $59,000 As Crypto Winter Ends
TL;DR Standard Chartered’s Geoffrey Kendrick reportedly says Bitcoin’s $59,000 area marked the cycle bottom. The note cites SpaceX...

Uranium Holds Above $85 as Mining ETF Rebounds From June Sell-Off
The latest charts display that the market is divided into stable physical prices and uranium shares trying to regain momentum afte...

US forces shoot down Iranian attack drones near Strait of Hormuz, Bitcoin drops below $73K
Geopolitical tensions near vital oil routes can destabilize financial markets, highlighting the interconnectedness of global secur...

XRP aims for $0.90 as ETF demand battles selling pressure from whales
XRP is trading at $1.11, down roughly 17% from its June opening, having set a new 2026 low on June 5 and shed $8 billion in market...

BTC Momentum Turns Positive as Bitcoin Fights to Hold the $64,000 Zone
Bitcoin ( BTC) is trading at $64,549 per coin on June 14, 2026, at 8 a.m. Eastern time, holding above a critical demand zone while...

Tether USDT Briefly Overtakes Ethereum in Market Cap: A $187B Wake-Up Call
For a few hours, earlier this week, Tether USDT stablecoin held a higher market cap than Ethereum, the first time that has happene...