Chainlink (LINK) Primed for Another Surge: Major Rally on the Horizon?
Chainlink’s LINK price is gaining bullish momentum above $16.50. The price could continue to move up if it clears the $17.50 resistance zone. Chainlink price is showing bullish signs and eyeing more gains above $17.00 ag...

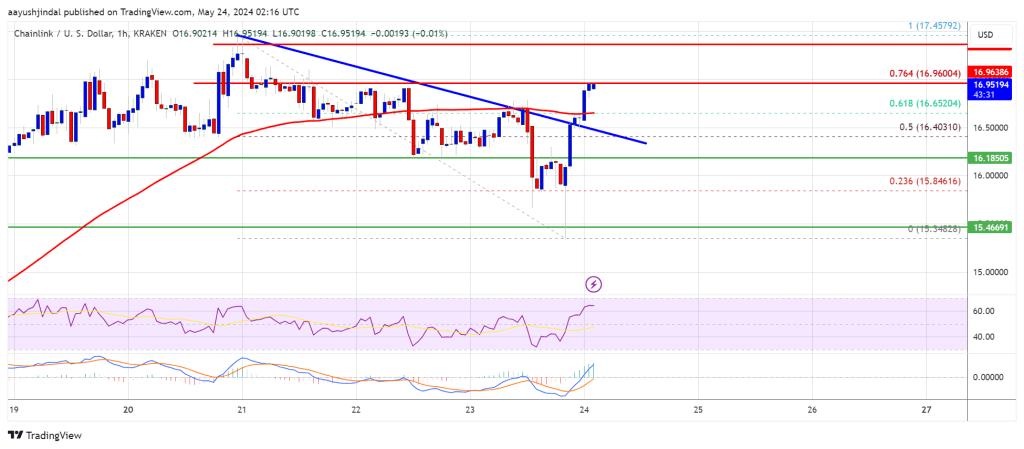
Chainlink’s LINK price is gaining bullish momentum above $16.50. The price could continue to move up if it clears the $17.50 resistance zone.
- Chainlink price is showing bullish signs and eyeing more gains above $17.00 against the US dollar.
- The price is trading above the $16.50 level and the 100-hourly simple moving average.
- There was a break above a key bearish trend line with resistance near $16.50 on the hourly chart of the LINK/USD pair (data source from Kraken).
- The price could start another increase if it clears the $17.50 resistance zone.
In the past few days, Chainlink remained in a positive zone above the $15.00 level, like Bitcoin and Ethereum. There was a move above the $16.50 and $17.00 levels. A high was formed at $17.45 before there was a downside correction.
The price dipped below $16.50 and tested $15.35. A low was formed at $15.34 and the price recently attempted a fresh increase. There was a move above the $16.50 level. It even jumped above the 50% Fib retracement level of the downward move from the $17.45 swing high to the $15.34 low.
Besides, there was a break above a key bearish trend line with resistance near $16.50 on the hourly chart of the LINK/USD pair. Chainlink is now trading above the $16.50 level and the 100 simple moving average (4 hours).
Immediate resistance is near the $16.90 level or the 76.4% Fib retracement level of the downward move from the $17.45 swing high to the $15.34 low. The next major resistance is near the $17.50 zone. A clear break above $17.50 may possibly start a steady increase toward the $18.20 level. The next major resistance is near the $18.80 level, above which the price could test $20.00.
Another Decline In LINK?If Chainlink’s price fails to climb above the $17.50 resistance level, there could be a fresh decline. Initial support on the downside is near the $16.65 level.
The next major support is near the $16.20 level, below which the price might test the $15.50 level. Any more losses could lead LINK toward the $15.00 level in the near term.
Technical Indicators
Hourly MACD – The MACD for LINK/USD is gaining momentum in the bullish zone.
Hourly RSI (Relative Strength Index) – The RSI for LINK/USD is now above the 50 level.
Major Support Levels – $16.65 and $16.20.
Major Resistance Levels – $17.00 and $17.50.
Original source
Read on NewsBTCRelated market context

Standard Chartered Says Bitcoin Bottomed Near $59,000 As Crypto Winter Ends
TL;DR Standard Chartered’s Geoffrey Kendrick reportedly says Bitcoin’s $59,000 area marked the cycle bottom. The note cites SpaceX...

Uranium Holds Above $85 as Mining ETF Rebounds From June Sell-Off
The latest charts display that the market is divided into stable physical prices and uranium shares trying to regain momentum afte...

Kraken, Chainlink, and Chiliz ride crypto’s biggest mainstream stage as FIFA World Cup kicks off
Crypto's integration into the World Cup could drive mainstream adoption, testing blockchain scalability and potentially boosting i...

Crypto’s World Cup play: Kraken, Chainlink, and Algorand stake claims while USMNT sits on the sidelines
The USMNT's lack of crypto partnerships highlights missed opportunities for fan engagement and revenue in a rapidly growing digita...
FIFA World Cup 2026 kicks off with crypto partnerships from Kraken, Chainlink, and Chiliz
The 2026 FIFA World Cup's crypto partnerships could significantly boost blockchain adoption and reshape fan engagement in sports....

FIFA World Cup 2026 kicks off with crypto partnerships from Kraken, Chainlink, and Avalanche
The integration of crypto in the 2026 World Cup could accelerate blockchain adoption, offering new legitimacy and infrastructure f...