Chainlink’s (LINK) Outlook Grows Bleak: Signals of Bearish Continuation Surface
Chainlink’s LINK price is struggling to surpass the $13.80 resistance. The price could continue to move down if it breaks the $13.00 support. Chainlink price is showing bearish signs below the $14.00 resistance against t...

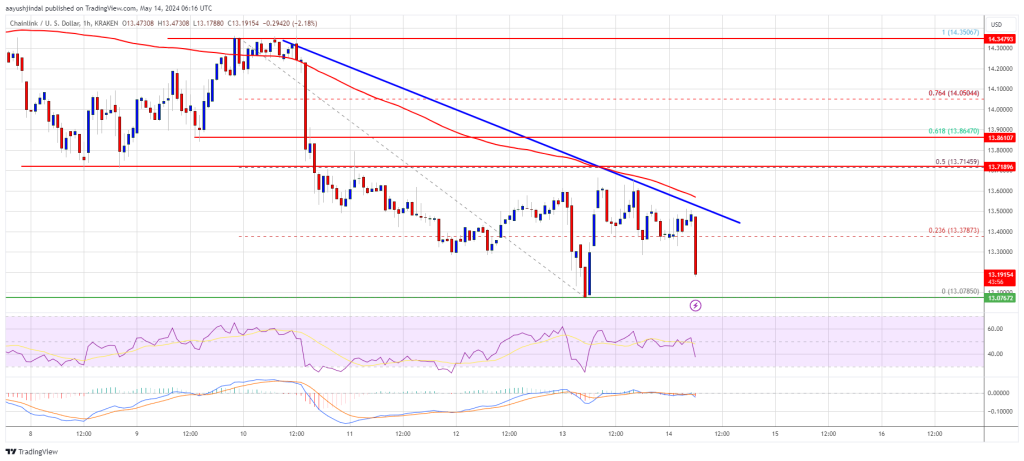
Chainlink’s LINK price is struggling to surpass the $13.80 resistance. The price could continue to move down if it breaks the $13.00 support.
- Chainlink price is showing bearish signs below the $14.00 resistance against the US dollar.
- The price is trading below the $13.60 level and the 100 simple moving average (4 hours).
- There is a key bearish trend line forming with resistance near $13.50 on the 4-hour chart of the LINK/USD pair (data source from Kraken).
- The price could start a decent increase if it clears the $13.80 resistance zone.
In the past few days, Chainlink saw a steady decline from well above the $13.80 level. LINK price declined below the $13.50 support level to enter a short-term bearish zone, like Bitcoin and Ethereum.
The price tested the $13.10 support zone. A low was formed at $13.07 and the price recently attempted a recovery wave. There was a move above the $13.50 level. It even jumped above the 23.6% Fib retracement level of the downward move from the $14.30 swing high to the $13.07 low.
However, the bears were active below the $13.80 resistance and the 50% Fib retracement level of the downward move from the $14.30 swing high to the $13.07 low. LINK price is still trading below the $13.80 level and the 100 simple moving average (4 hours).
Immediate resistance is near the $13.50 level. There is also a key bearish trend line forming with resistance near $13.50 on the 4-hour chart of the LINK/USD pair.
The next major resistance is near the $13.80 zone. A clear break above $13.80 may possibly start a steady increase toward the $14.00 level. The next major resistance is near the $14.35 level, above which the price could test $15.50.
More Losses?If Chainlink’s price fails to climb above the $13.50 resistance level, there could be a fresh decline. Initial support on the downside is near the $13.10 level.
The next major support is near the $12.80 level, below which the price might test the $12.20 level. Any more losses could lead LINK toward the $11.50 level in the near term.
Technical Indicators
4 hours MACD – The MACD for LINK/USD is gaining momentum in the bearish zone.
4 hours RSI (Relative Strength Index) – The RSI for LINK/USD is now below the 50 level.
Major Support Levels – $13.10 and $12.80.
Major Resistance Levels – $13.50 and $13.80.
Original source
Read on NewsBTCRelated market context

Bitcoin Stabilizes Near Key Zone, But Glassnode Warns Capital Flows Remain Weak
Bitcoin’s rebound from the $60,000 area has given bulls something to work with, but Glassnode’s latest market read suggests the re...

BTC News Today: Bitcoin Climbs Toward $66K as Trump Reveals US-Iran Peace Deal
The renewed geopolitical optimism helped improve risk sentiment across financial markets, pushing Bitcoin back toward the $66,000...

Ethereum Price Prediction: ETH is Still Below Its 200 Week SMA, and Tom Lee Buying Spree Might End Soon
Ethereum price is trading above $1,700 after running for 5% today, and even our prediction model is calling for more leg higher. H...

Did Tether just freeze $72M in USDT with no link to a hack in Monero money laundering sting?
A Tron address reportedly received 120.2 million USDT last week and began routing funds before Tether reportedly froze about $72 m...

Bitcoin Price and Crypto Stocks Surge as Iran Ceasefire, Strategy’s $100M Buy Collide With Fed Week
Bitcoin Magazine Bitcoin Price and Crypto Stocks Surge as Iran Ceasefire, Strategy’s $100M Buy Collide With Fed Week Bitcoin price...

XRP Price Prediction: US-Iran Peace Deal Fuels 13% XRP Surge, Analysts Target $1.94 Retest
The latest move saw XRP price today reclaim the $1.28 level for the first time in nearly two weeks. Market participants pointed to...