Dogecoin Breaks Under Ascending Triangle: 16% Crash Incoming?
An analyst has pointed out how Dogecoin could end up seeing an extended drawdown, based on this Ascending Triangle pattern forming in its hourly price. Dogecoin Has Lost The Support Of An Ascending Triangle Recently In a...
Archive context
Older archive item. Useful for background and entity history, but not a fresh market-moving signal.

An analyst has pointed out how Dogecoin could end up seeing an extended drawdown, based on this Ascending Triangle pattern forming in its hourly price.
Dogecoin Has Lost The Support Of An Ascending Triangle RecentlyIn a new post on X, analyst Ali Martinez has talked about an Ascending Triangle pattern for Dogecoin. The “Ascending Triangle” refers to a technical analysis (TA) formation that appears when the price of an asset consolidates inside a triangular region.
The ‘Ascending’ in the pattern’s name comes from the fact that this consolidation happens towards a net upside. There are two trendlines in this pattern: an upper level that’s parallel to the time-axis, tracing successive highs, and a lower one that has a positive slope, connecting successive higher lows.
Just like with any other consolidation pattern in TA, the upper level of the triangle is likely to be a source of resistance in the near future, while the lower one that of support. A break out of either of these boundaries can signal a continuation of trend in that direction.
The Ascending Triangle isn’t the only type of triangular pattern in TA, two other popular varieties include the Descending Triangle and Symmetrical Triangle. The former of these is just the opposite of the Ascending Triangle: it forms when the price consolidates to the downside instead.
The latter, the Symmetrical Triangle, is a sort of middle-ground between the Ascending and Descending versions, with both of its trendlines having an equal and opposite slope. That is, when the asset is inside this pattern, it converges at a mid-point.
Recently, Dogecoin’s 1-hour price looked like it was following an Ascending Triangle. Here is the chart shared by Martinez, that shows this pattern for the memecoin:
As is visible in the above graph, the hourly Dogecoin price recently made a retest of the lower line of this Ascending Triangle, but it would appear the coin has been unsuccessful in finding support at it, as it has slipped right through.
From the graph, it’s apparent that the memecoin wasn’t far from the apex of the triangle when this break came. Consolidation gets narrower as an asset reaches the end of the pattern, so breakouts start to become more likely.
As mentioned before, a breakout can mean a potential continuation of trend in the direction of the break. So, in this case, DOGE has just witnessed a bearish signal. Often, the length of a move emerging out of an Ascending Triangle breakout is of the same length as the height of the triangle itself. Based on this, the analyst notes a 16% price swing could occur for the coin as a result of pattern.
DOGE PriceDogecoin has taken to flat movement in the past week as its price is still floating around the $0.16 mark.
Why this matters
This altcoin story adds another data point to the current market tape and is useful when read alongside nearby source coverage.
Original source
Read on NewsBTCRelated market context

Bank Plans on CLARITY Act Send Circle and Coinbase Shares Lower
Circle (CRCL) and Coinbase (COIN) shares both fell more than 3% after reports that JPMorgan Chase and a consortium of major banks...
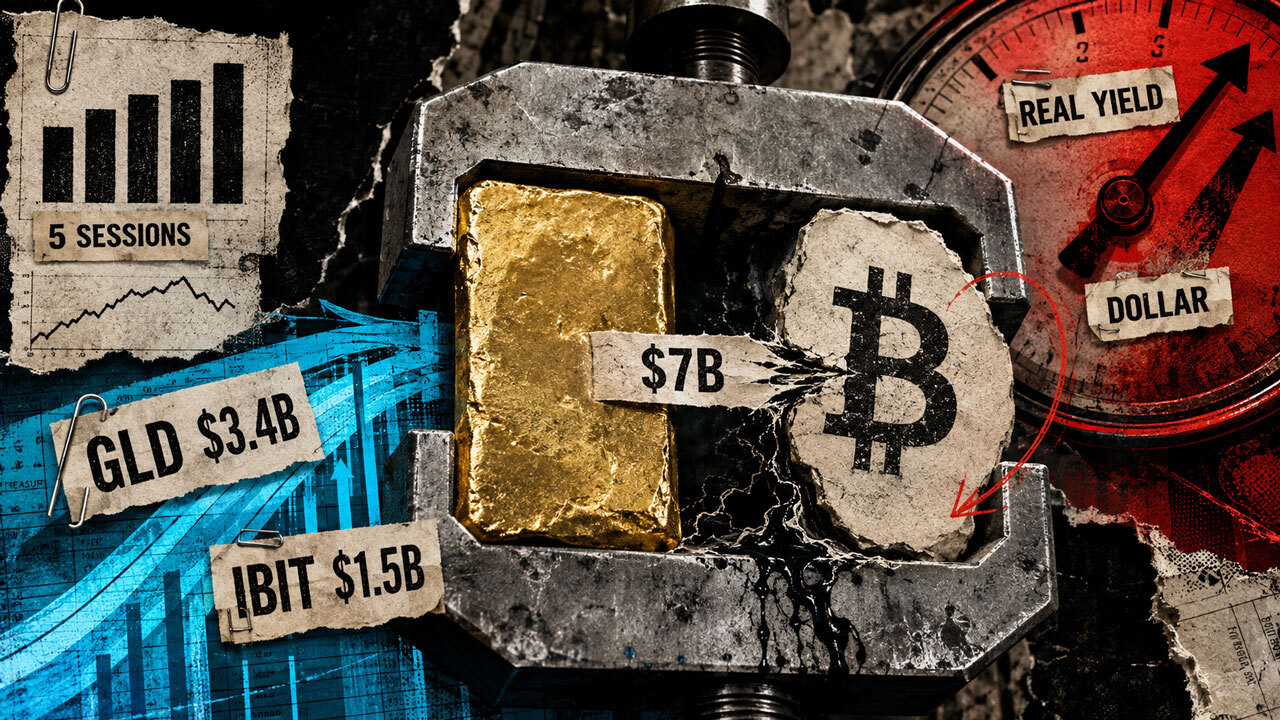
Investors just moved $7 billion into Bitcoin and gold in five days to escape an accelerating dollar crisis
Gold and Bitcoin exchange-traded funds (ETFs) drew roughly $7 billion over five US trading sessions, a record combined haul that p...
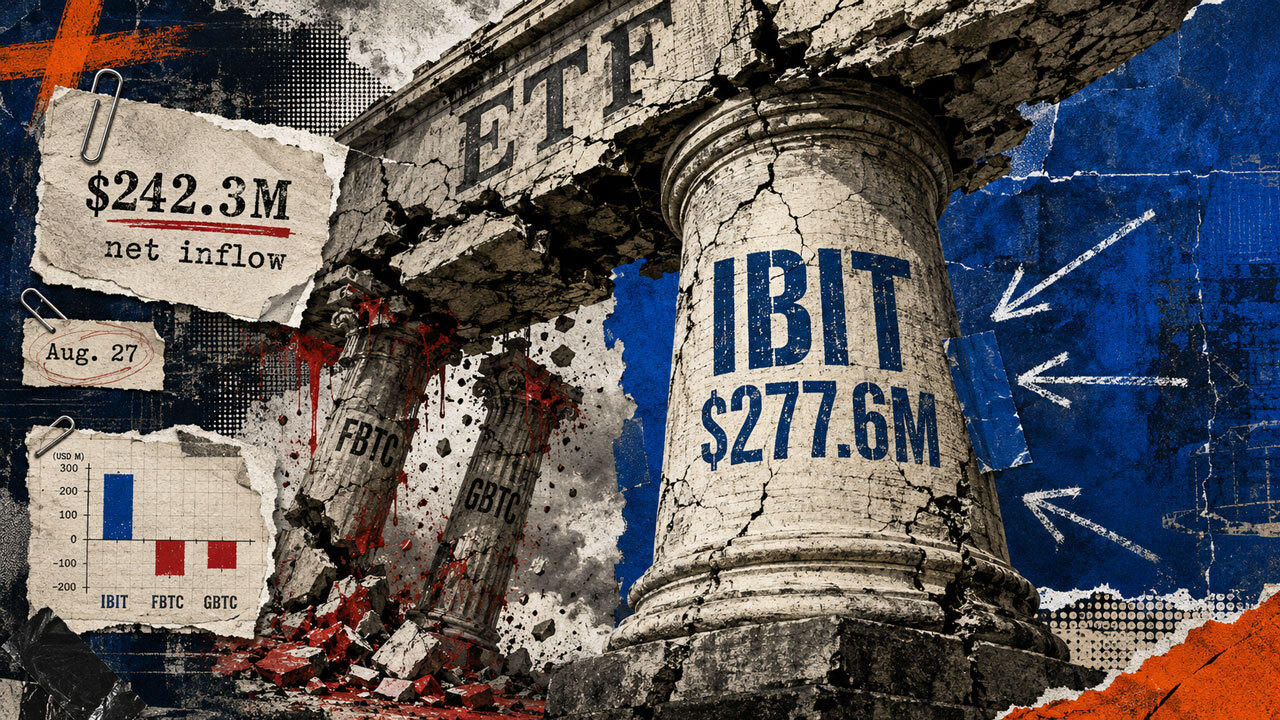
BlackRock just pulled in 115% of all Bitcoin ETF inflows in a single day as rival funds bleed cash
BlackRock’s iShares Bitcoin Trust (IBIT) pulled in more money than the entire US Bitcoin exchange-traded fund (ETF) market gained...

JPMorgan’s IBIT Bitcoin ETF bet just missed its escape hatch to avoid 6% deduction
The iShares Bitcoin Trust ETF (IBIT) closed at $44.46 on Aug. 26, about 30.2% below the $63.69 price needed to trigger an early ex...

It just got 25 times easier to move self-custody Bitcoin directly onto Wall Street, and $5 billion already has
BlackRock cut the minimum for converting privately held Bitcoin into IBIT shares from $25 million to $1 million, while Bitwise low...

Bitcoin (BTC) Price Prediction: Hidden Weekly RSI Divergence Warns of Pullback as BTC Tests $80K
Bitcoin price was trading around $80,500 on Bitstamp in the latest technical reading, up 3.11% on the session. While the price rem...