Dogecoin (DOGE) Bulls Aim to Clear $0.10: Will It Happen?
Dogecoin started a recovery wave from the $0.0888 zone against the US Dollar. DOGE is rising and might even clear the $0.100 resistance zone. DOGE price is aiming for a fresh increase above $0.100. The price is trading a...

Dogecoin started a recovery wave from the $0.0888 zone against the US Dollar. DOGE is rising and might even clear the $0.100 resistance zone.
- DOGE price is aiming for a fresh increase above $0.100.
- The price is trading above the $0.0950 level and the 100-hourly simple moving average.
- There was a break above a connecting bearish trend line with resistance at $0.0955 on the hourly chart of the DOGE/USD pair (data source from Kraken).
- The price could gain bullish momentum if it clears the $0.0980 and $0.100 levels.
After a major decline, Dogecoin price found support near the $0.0888 zone. The price formed a base and recently started a recovery wave like Bitcoin and Ethereum. There was a move above the $0.0920 and $0.0935 resistance levels.
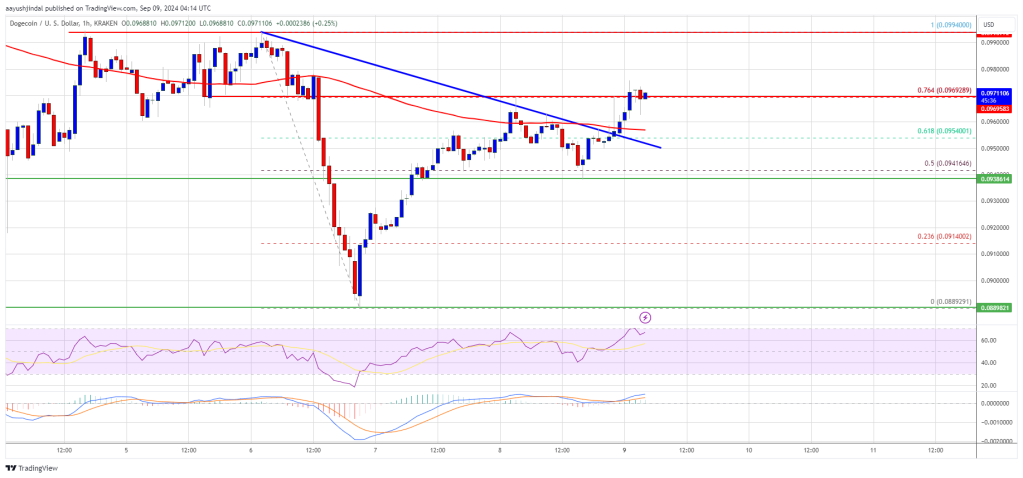
The price cleared the 50% Fib retracement level of the downward move from the $0.0994 swing high to the $0.0889 low. There was also a break above a connecting bearish trend line with resistance at $0.0955 on the hourly chart of the DOGE/USD pair.
Dogecoin price is now trading above the $0.0950 level and the 100-hourly simple moving average. Immediate resistance on the upside is near the $0.0970 level or the 76.4% Fib retracement level of the downward move from the $0.0994 swing high to the $0.0889 low.
The next major resistance is near the $0.0995 level. A close above the $0.0995 resistance might send the price toward the $0.1050 resistance. Any more gains might send the price toward the $0.1150 level. The next major stop for the bulls might be $0.1200.
Another Decline In DOGE?If DOGE’s price fails to climb above the $0.0995 level, it could start another decline. Initial support on the downside is near the $0.0938 level. The next major support is near the $0.0900 level.
The main support sits at $0.0880. If there is a downside break below the $0.0880 support, the price could decline further. In the stated case, the price might decline toward the $0.0850 level or even $0.0835 in the near term.
Technical Indicators
Hourly MACD – The MACD for DOGE/USD is now gaining momentum in the bullish zone.
Hourly RSI (Relative Strength Index) – The RSI for DOGE/USD is now above the 50 level.
Major Support Levels – $0.0938 and $0.0900.
Major Resistance Levels – $0.0995 and $0.1050.
Original source
Read on NewsBTCRelated market context

Uranium Holds Above $85 as Mining ETF Rebounds From June Sell-Off
The latest charts display that the market is divided into stable physical prices and uranium shares trying to regain momentum afte...

Elon Musk’s trillionaire status puts his net worth above crypto’s entire market cap outside Bitcoin
Elon Musk has become the first person in modern history to amass a personal net worth exceeding $1 trillion, crossing the historic...

Bitcoin rises above $64,000 after Pakistan prime minister says Iran peace deal is near
Bitcoin traded above $64,000 on Saturday, supported by its strongest ETF inflows in a month and growing optimism around geopolitic...

Standard Chartered Says Bitcoin Bottomed Near $59,000 As Crypto Winter Ends
TL;DR Standard Chartered’s Geoffrey Kendrick reportedly says Bitcoin’s $59,000 area marked the cycle bottom. The note cites SpaceX...

BTC Momentum Turns Positive as Bitcoin Fights to Hold the $64,000 Zone
Bitcoin ( BTC) is trading at $64,549 per coin on June 14, 2026, at 8 a.m. Eastern time, holding above a critical demand zone while...

Bitcoin price challenges $64,000 weekend wall – needing a breakout or risk a deeper correction
Bitcoin reclaimed $64,000 on June 12 and touched an intraday high of $64,301 in the same session that spot ETF flows finally flipp...