Dogecoin (DOGE) Maintains Support Amid Market Weakness, Bulls Seek Confirmation Bounce
Dogecoin corrected some gains and traded below $0.1780 against the US Dollar. DOGE is now holding the $0.1680 support and might aim for a fresh increase. DOGE price started a fresh downside correction below $0.1780. The...

Dogecoin corrected some gains and traded below $0.1780 against the US Dollar. DOGE is now holding the $0.1680 support and might aim for a fresh increase.
- DOGE price started a fresh downside correction below $0.1780.
- The price is trading below the $0.1760 level and the 100-hourly simple moving average.
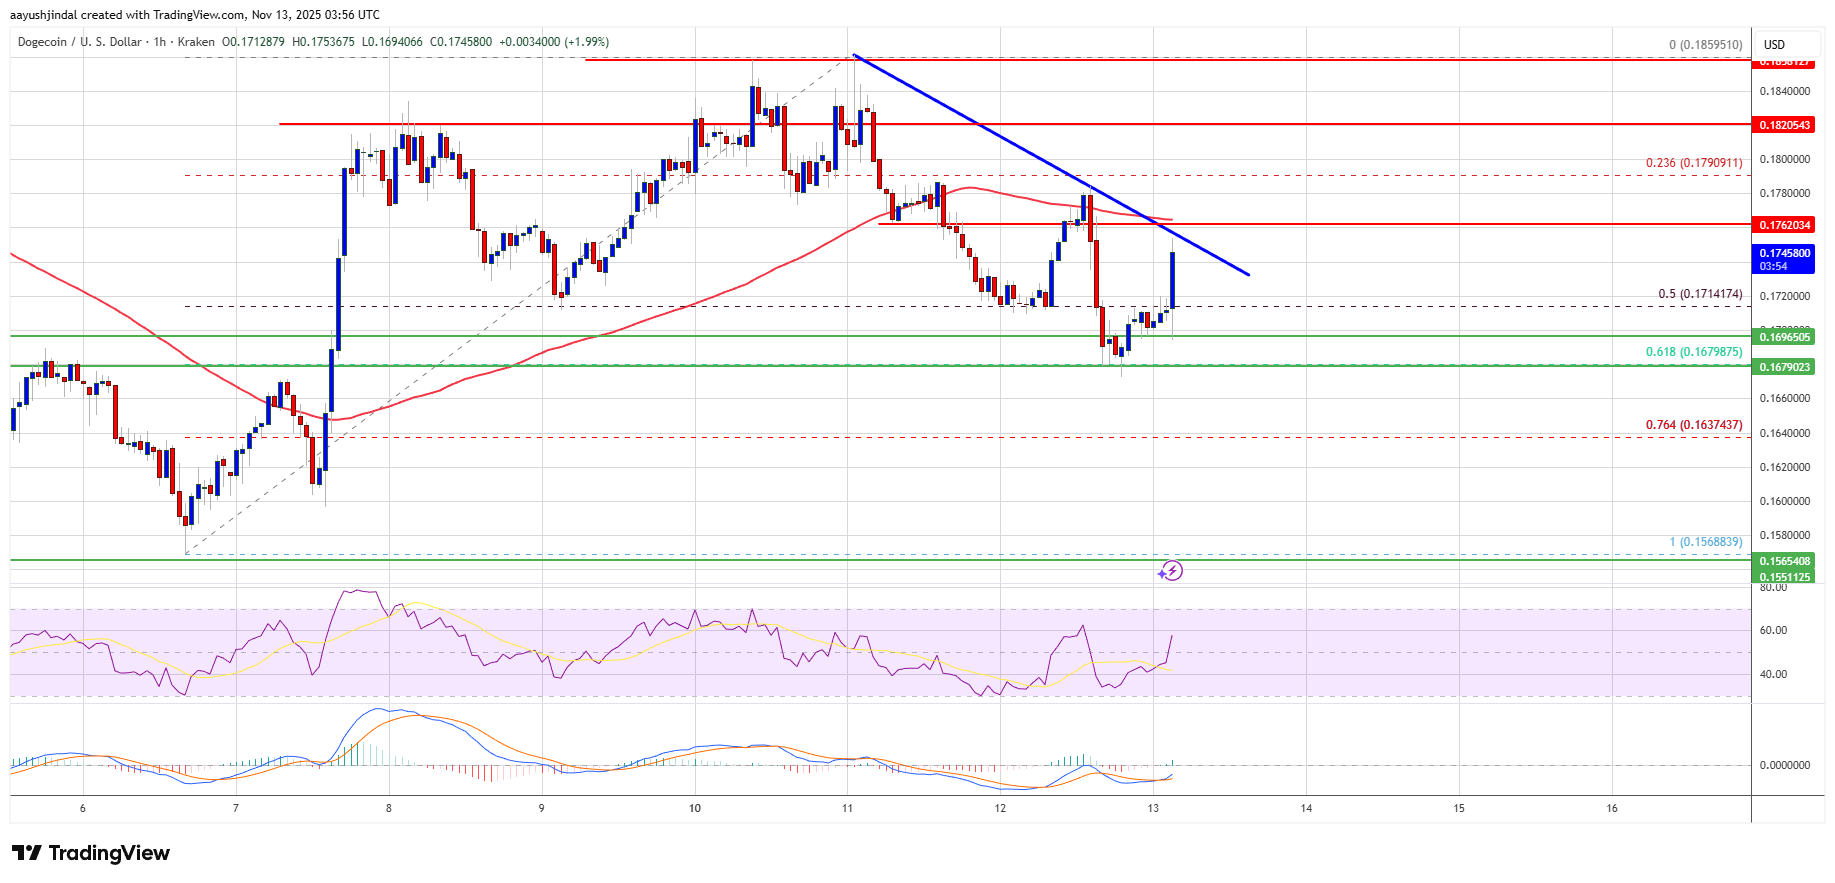
- There is a bearish trend line forming with resistance at $0.1760 on the hourly chart of the DOGE/USD pair (data source from Kraken).
- The price could aim for a fresh increase if it remains stable above $0.1680.
Dogecoin price started a downside correction after it failed to clear $0.1880, like Bitcoin and Ethereum. DOGE declined below $0.1820 and $0.180 levels.
There was a move below the 50% Fib retracement level of the upward move from the $0.1568 swing low to the $0.1858 high. However, the bulls remained active near the $0.1680 support. The price is again rising above $0.1720.
Dogecoin price is now trading below the $0.1780 level and the 100-hourly simple moving average. Immediate resistance on the upside is near the $0.1760 level. There is also a bearish trend line forming with resistance at $0.1760 on the hourly chart of the DOGE/USD pair.
The first major resistance for the bulls could be near the $0.1820 level. The next major resistance is near the $0.1880 level. A close above the $0.1880 resistance might send the price toward $0.1920. Any more gains might send the price toward $0.20. The next major stop for the bulls might be $0.2120.
Another Decline In DOGE?If DOGE’s price fails to climb above the $0.1820 level, it could continue to move down. Initial support on the downside is near the $0.170 level. The next major support is near the $0.1680 level and the 61.8% Fib retracement level of the upward move from the $0.1568 swing low to the $0.1858 high.
The main support sits at $0.1640. If there is a downside break below the $0.1640 support, the price could decline further. In the stated case, the price might slide toward the $0.1550 level or even $0.1520 in the near term.
Technical Indicators
Hourly MACD – The MACD for DOGE/USD is now gaining momentum in the bullish zone.
Hourly RSI (Relative Strength Index) – The RSI for DOGE/USD is now above the 50 level.
Major Support Levels – $0.1700 and $0.1680.
Major Resistance Levels – $0.1760 and $0.1820.
Original source
Read on NewsBTCRelated market context

Bitcoin (BTC) Price Prediction: BTC Eyes $70K Liquidity Sweep as Whales Reclaim Control Near $62K
Market data suggests that long-term holders remain largely inactive, while whale activity is beginning to recover, creating an int...

Most Traders Will Scroll Past This Grok AI Bitcoin Predicts, Big Mistake
Elon Musk Grok AI just looked at a Bitcoin chart down more than 50% and predicts it’s a classic accumulation zone, targeting $150,...

Bitcoin’s $60,000 support is still a bet on the dollar breaking
Glassnode's latest Week On-chain report says Bitcoin has entered a deep discount phase, with over 95% of short-term holders underw...

XRP Price Prediction: Japan XRP ETF Listing is Getting Closer
Japan just handed XRP bulls a major regulatory tailwind. XRP price is retesting a congestion zone, and the prediction could turn b...

While bitcoin holds near $63,000, some data points to pain ahead for bulls
Onchain data shows the bitcoin market price is only just above its realized price and demand is weakening, especially from ETFs.

The 3-Part Impulse That Shows Where The XRP Price Is Headed Next
XRP bulls are trying to turn a brutal selloff into something bigger than a relief bounce. An interesting setup shows a possible th...