Dogecoin (DOGE) Recovery Sees Uptick — But Lacks Follow‑Through at $0.168
Dogecoin started a fresh increase above the $0.160 zone against the US Dollar. DOGE is now consolidating and might aim for a move above $0.1680. DOGE price started a fresh increase above the $0.1520 and $0.160 levels. Th...
Archive context
Older archive item. Useful for background and entity history, but not a fresh market-moving signal.

Dogecoin started a fresh increase above the $0.160 zone against the US Dollar. DOGE is now consolidating and might aim for a move above $0.1680.
- DOGE price started a fresh increase above the $0.1520 and $0.160 levels.
- The price is trading above the $0.1620 level and the 100-hourly simple moving average.
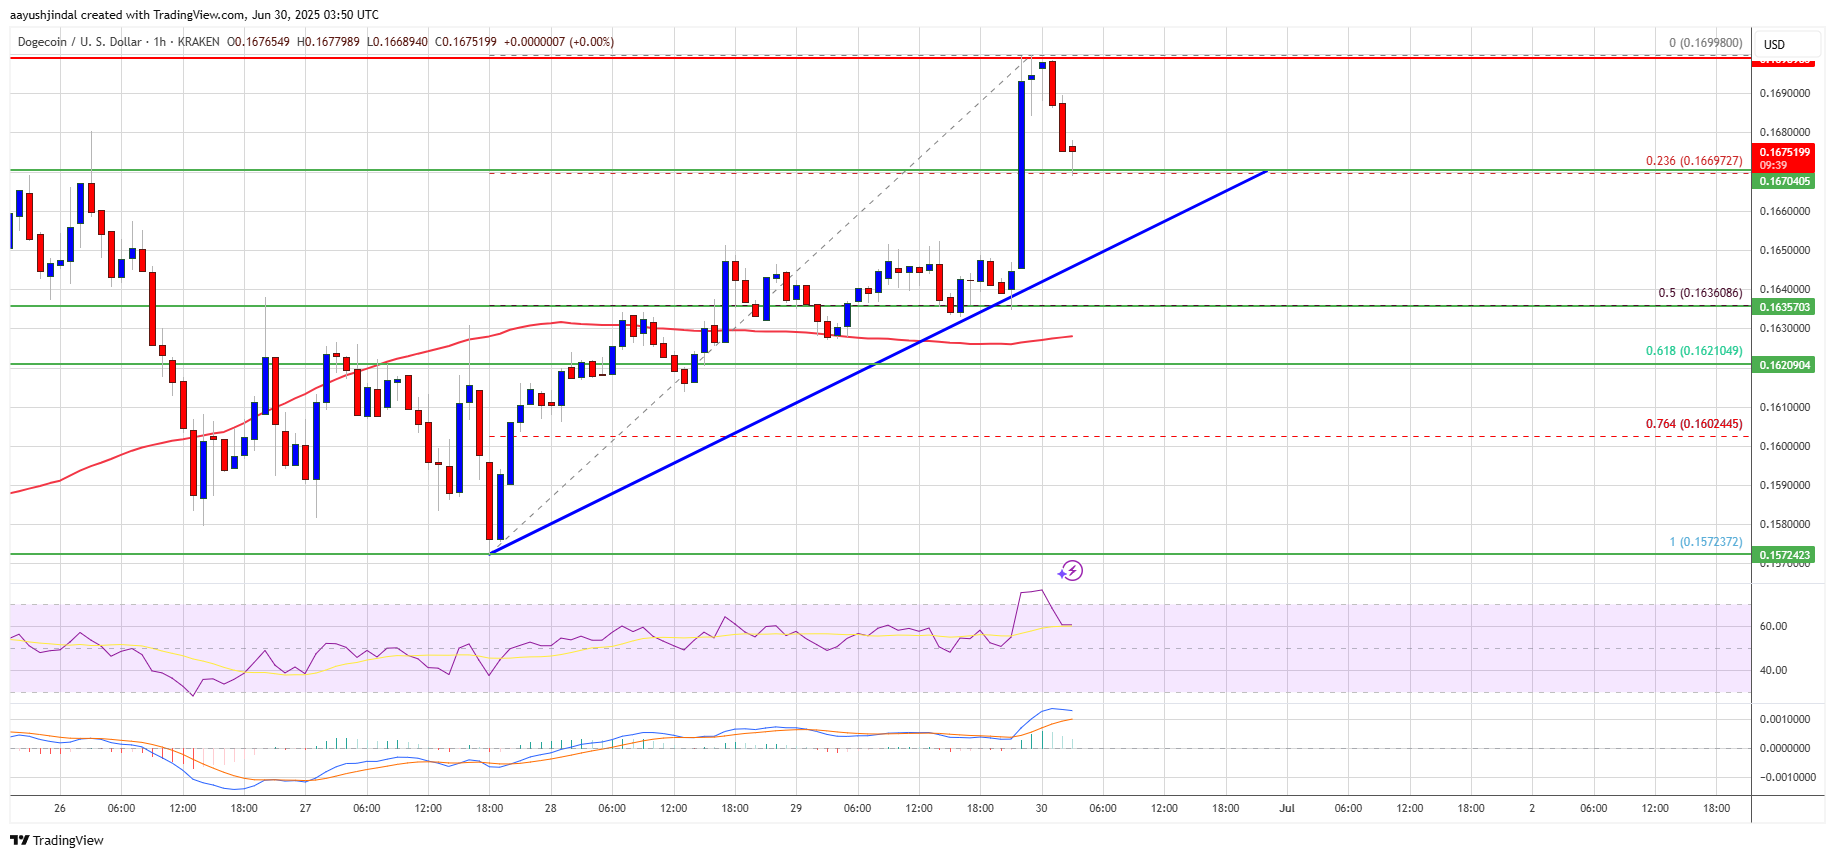
- There is a key bullish trend line forming with support at $0.1650 on the hourly chart of the DOGE/USD pair (data source from Kraken).
- The price could start a fresh decline if it stays below the $0.1680 zone.
Dogecoin price started a fresh increase above the $0.1450 zone, like Bitcoin and Ethereum. DOGE was able to climb above the $0.1550 and $0.160 resistance levels.
The bulls even pushed the price above the $0.1650 resistance. A high was formed at $0.1699 and the price is now consolidating gains above the 23.6% Fib retracement level of the upward move from the $0.1572 swing low to the $0.1699 high.
Dogecoin price is now trading above the $0.1650 level and the 100-hourly simple moving average. There is also a key bullish trend line forming with support at $0.1650 on the hourly chart of the DOGE/USD pair.
Immediate resistance on the upside is near the $0.1680 level. The first major resistance for the bulls could be near the $0.1720 level. The next major resistance is near the $0.1750 level. A close above the $0.1750 resistance might send the price toward the $0.180 resistance. Any more gains might send the price toward the $0.200 level. The next major stop for the bulls might be $0.2120.
Another Drop In DOGE?If DOGE’s price fails to climb above the $0.1680 level, it could start another decline. Initial support on the downside is near the $0.1660 level or the trend line zone. The next major support is near the $0.1620 level and the 61.8% Fib retracement level of the upward move from the $0.1572 swing low to the $0.1699 high.
The main support sits at $0.160. If there is a downside break below the $0.160 support, the price could decline further. In the stated case, the price might decline toward the $0.150 level or even $0.1450 in the near term.
Technical Indicators
Hourly MACD – The MACD for DOGE/USD is now losing momentum in the bullish zone.
Hourly RSI (Relative Strength Index) – The RSI for DOGE/USD is now above the 50 level.
Major Support Levels – $0.1650 and $0.1620.
Major Resistance Levels – $0.1680 and $0.1800.
Why this matters
This altcoin story adds another data point to the current market tape and is useful when read alongside nearby source coverage.
Original source
Read on NewsBTCRelated market context

Ethereum (ETH) Price Prediction: ETH Holds Near $1,780 as Bulls Eye $1,860–$1,950, but $1,609 Remains Key Invalidation
Ethereum price is trading near $1,779 after a mixed 24-hour session, according to Brave New Coin data. ETH is down around 0.76% on...

Bitcoin (BTC) Price Prediction: BTC Holds $63K Support—Can Rising Active Addresses Offset Bearish Technical Signals?
Although the BTC price has remained near a key support zone, recent chart signals and Strategy’s sale of a portion of its Bitcoin...

Bitcoin Price Prediction: Peter Brandt Might Dump BTC for Gold
Bitcoin is facing a test, and its price prediction is not helping. So far in 2026, BTC has fallen about 28%, while gold is down ju...

XRP Price Prediction: Volume and ETF Inflow Send Ripple Token Higher
XRP price pushed above the $1.14 resistance area after buyers stepped in with heavy volume and bullish prediction. The token climb...

Bitcoin miner bottom signal now depends on who survives weak mining profits
A Bitcoin miner-stress signal circulating on X has fallen into a zone analysts associate with severe miner pressure, putting a fam...

Vitalik Buterin Says Ethereum’s Next Major Upgrade Will Take Three to Four Years and Rival the Merge
Ethereum co-founder Vitalik Buterin says the network’s next major overhaul, an initiative researchers are calling “Lean Ethereum,”...