Dogecoin (DOGE) Stages A Recovery Attempt After A Brutal Selloff
Dogecoin started a recovery wave above the $0.0820 zone against the US Dollar. DOGE is now facing hurdles near $0.090 and might struggle to continue higher. DOGE price started a recovery wave from $0.0775 and climbed abo...
Archive context
Older archive item. Useful for background and entity history, but not a fresh market-moving signal.

Dogecoin started a recovery wave above the $0.0820 zone against the US Dollar. DOGE is now facing hurdles near $0.090 and might struggle to continue higher.
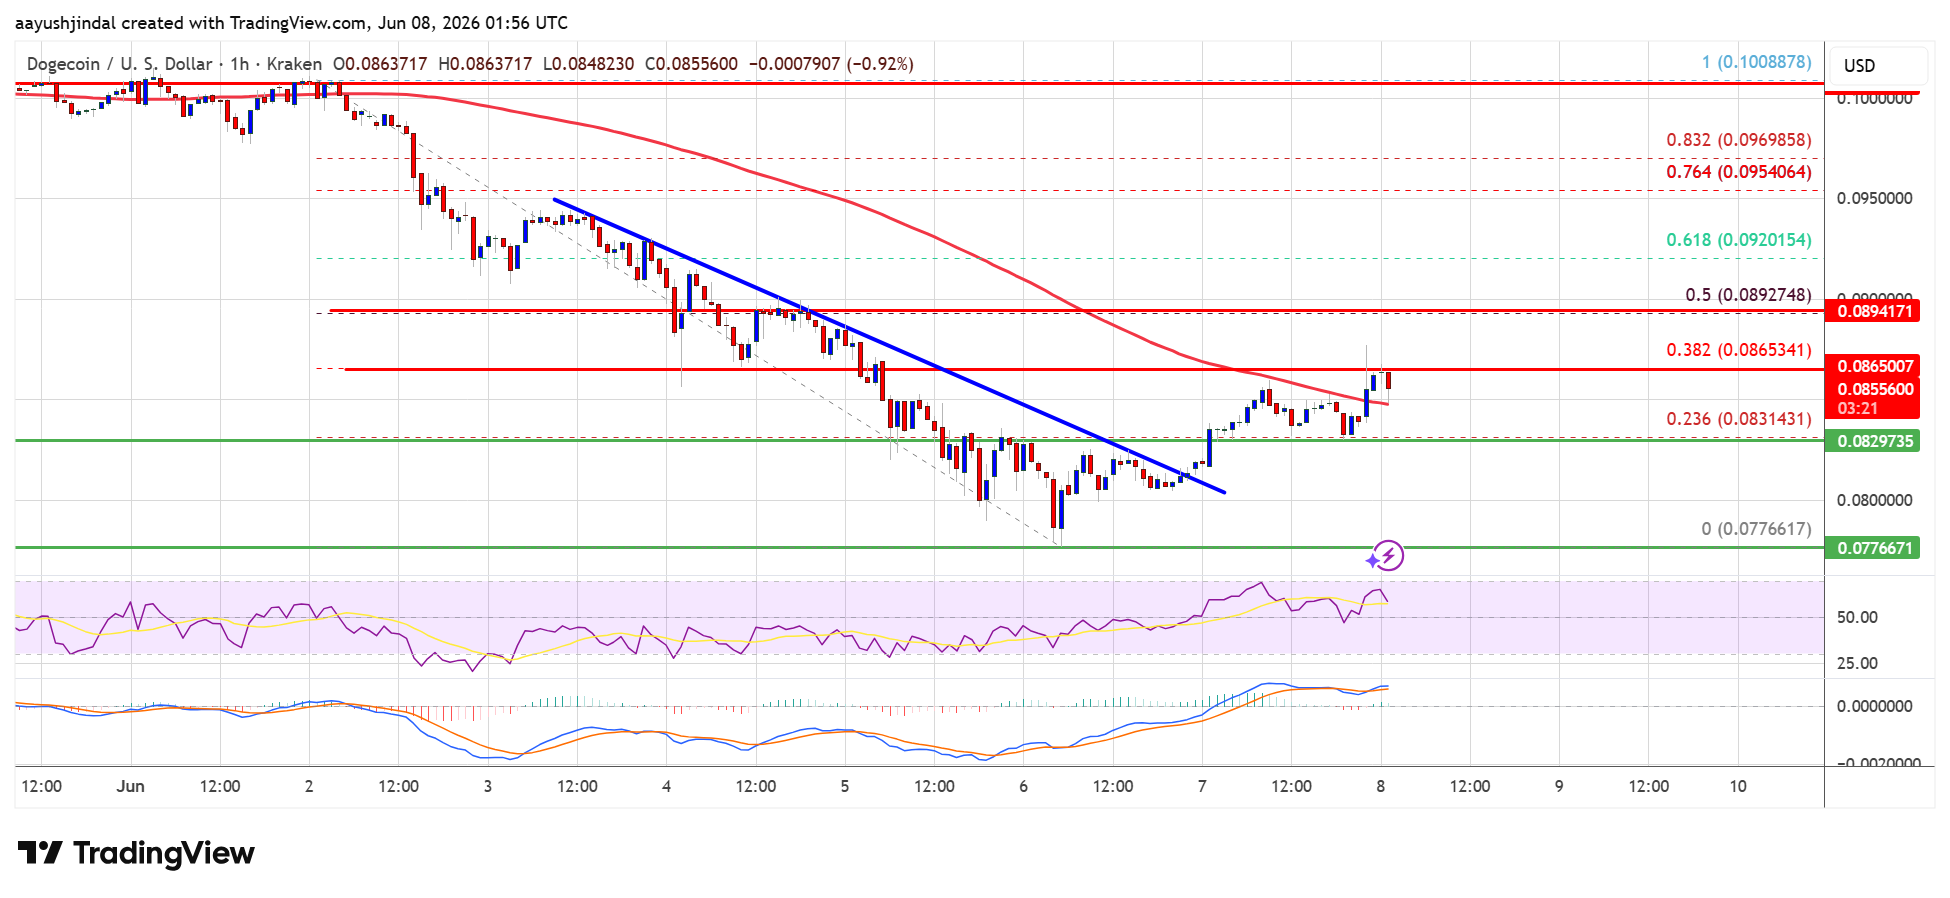
- DOGE price started a recovery wave from $0.0775 and climbed above $0.0820.
- The price is trading below the $0.0820 level and the 100-hourly simple moving average.
- There was a break above a bearish trend line with resistance at $0.0820 on the hourly chart of the DOGE/USD pair (data source from Kraken).
- The price could continue to move up if it stays above $0.090.
Dogecoin price started a recovery wave from the $0.0775 zone, like Bitcoin and Ethereum. DOGE climbed above the $0.080 and $0.0820 resistance levels.
There was a break above a bearish trend line with resistance at $0.0820 on the hourly chart of the DOGE/USD pair. There was a decent upward move above the 23.6% Fib retracement level of the downward move from the $0.1008 swing high to the $0.0776 low.
Dogecoin price is now trading above the $0.0820 level and the 100-hourly simple moving average. If there is another recovery wave, immediate resistance on the upside is near the $0.0865 level.
The first major resistance for the bulls could be near the $0.090 level or the 50% Fib retracement level of the downward move from the $0.1008 swing high to the $0.0776 low. The next major resistance is near the $0.0920 level. A close above the $0.0920 resistance might send the price toward the $0.10 resistance. Any more gains might send the price toward the $0.1035 level. The next major stop for the bulls might be $0.1050.
Another Decline In DOGE?If DOGE’s price fails to climb above the $0.090 level, it could continue to move down. Initial support on the downside is near the $0.0840 level. The next major support is near the $0.0820 level.
The main support sits at $0.0820. If there is a downside break below the $0.0820 support, the price could decline further. In the stated case, the price might slide toward the $0.0775 level or even $0.0750 in the near term.
Technical Indicators
Hourly MACD – The MACD for DOGE/USD is now gaining momentum in the bullish zone.
Hourly RSI (Relative Strength Index) – The RSI for DOGE/USD is now above the 50 level.
Major Support Levels – $0.0820 and $0.080.
Major Resistance Levels – $0.090 and $0.0920.
Why this matters
Dogecoin is showing up inside the Memecoins theme, so this story is worth tracking for follow-through rather than treating it as a one-off headline.
Original source
Read on NewsBTCRelated market context

Dogecoin (DOGE) Price Prediction: Can Rare TD Sequential Buy Signals Trigger a Historic Reversal Toward $0.16?
The signals have emerged as Dogecoin trades near $0.073, close to a long-term technical area that has attracted attention from mar...

Ethereum Price in Limbo as Bitmine Inches Away From Its 5% Supply Target
Ethereum price is trading at $1,880, down 3.3% on the day after slipping from recent highs. The market remains caught between stea...

Arthur Hayes Holds 7,213 ETH as FOMC Jitters Drives Ethereum Price Drop
Arthur Hayes added 3,298 ETH worth $6.39 million on July 28, roughly three hours before Ethereum’s spot price slid from $1,960 to...

Ethereum L2 ecosystem loses momentum as TVL drops to two-year low
Total value locked in Ethereum Layer 2s has slid back to roughly $5 billion, a level last seen in 2023.
Lido Crypto Validator Consolidation Will Cut Ethereum’s Beacon Chain by 29%
Lido Crypto has launched its Core 2026 protocol upgrade, introducing native 0x02 validator support to its largest staking module,...

South Korea’s Stock Market Triggered 8th Circuit Breaker of 2026: Bitcoin Liquidated 3 Times Near $64,000
Bitcoin News: BTC price is trading at $63,582 on July 28, down 2.12% in the past 24 hours, and the level that keeps breaking trade...