Dogecoin (DOGE) Trims Gains, Can This Key Support Hold Losses?
Dogecoin started a fresh decline from the $0.1085 resistance against the US Dollar. DOGE is struggling and might soon test the $0.0980 support. DOGE price is gaining bearish momentum below $0.1035. The price is trading b...
Archive context
Older archive item. Useful for background and entity history, but not a fresh market-moving signal.

Dogecoin started a fresh decline from the $0.1085 resistance against the US Dollar. DOGE is struggling and might soon test the $0.0980 support.
- DOGE price is gaining bearish momentum below $0.1035.
- The price is trading below the $0.1020 level and the 100-hourly simple moving average.
- There is a key bearish trend line forming with resistance at $0.1050 on the hourly chart of the DOGE/USD pair (data source from Kraken).
- The price could extend losses and revisit the key support at $0.0980.
After a steady increase, Dogecoin price faced sellers near the $0.1085 level. The price formed a short-term top and started another decline below the $0.1050 level like Bitcoin and Ethereum.
There was a move below the $0.1035 support zone. The price dipped below the 50% Fib retracement level of the upward move from the $0.0978 swing low to the $0.1084 high. There is also a key bearish trend line forming with resistance at $0.1050 on the hourly chart of the DOGE/USD pair.
Dogecoin price is now trading below the $0.1035 level and the 100-hourly simple moving average. It is also testing the 76.4% Fib retracement level of the upward move from the $0.0978 swing low to the $0.1084 high.
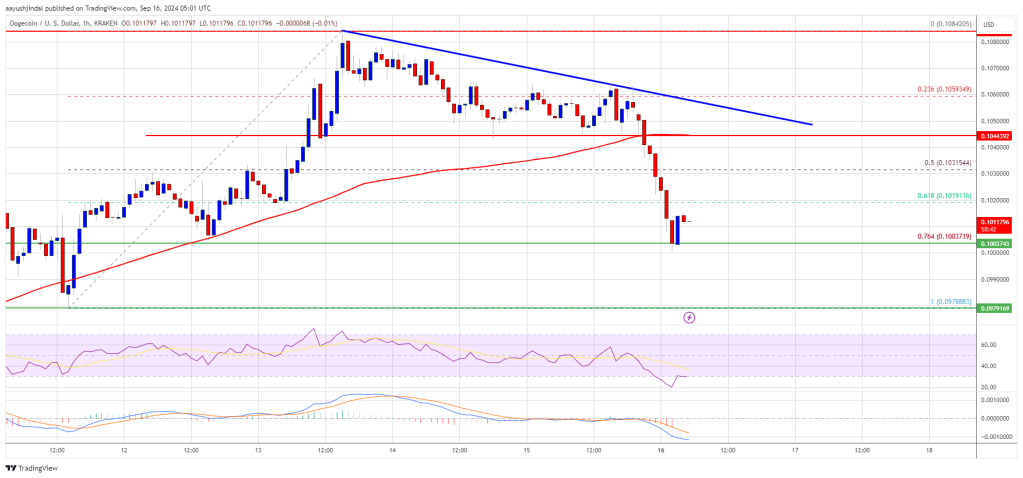
Immediate resistance on the upside is near the $0.1032 level. The next major resistance is near the $0.1045 level. A close above the $0.1045 resistance might send the price toward the $0.1050 resistance. Any more gains might send the price toward the $0.1085 level. The next major stop for the bulls might be $0.1120.
More Downsides In DOGE?If DOGE’s price fails to climb above the $0.1035 level, it could start another decline. Initial support on the downside is near the $0.1000 level. The next major support is near the $0.0980 level.
The main support sits at $0.0918. If there is a downside break below the $0.0918 support, the price could decline further. In the stated case, the price might decline toward the $0.0880 level or even $0.0850 in the near term.
Technical Indicators
Hourly MACD – The MACD for DOGE/USD is now gaining momentum in the bearish zone.
Hourly RSI (Relative Strength Index) – The RSI for DOGE/USD is now below the 50 level.
Major Support Levels – $0.0980 and $0.0918.
Major Resistance Levels – $0.1035 and $0.1050.
Why this matters
This altcoin story adds another data point to the current market tape and is useful when read alongside nearby source coverage.
Original source
Read on NewsBTCRelated market context

Where Could XRP Price Go This September as CLARITY Act Nears?
XRP price is at $1.32, down 3% on the day as it is sliding back toward the lower end of its recent range. But the real question is...

Ethereum (ETH) Price Prediction: ETH Struggles Below $2,550 as Bulls Look for the Next Recovery Setup
Ethereum price is trading around $2,463 after gaining roughly 1.79% over the past 24 hours, according to Brave New Coin data. The...

Google Gemini AI Predicts a +300% XRP Price Surge by 2027
We asked Google Gemini AI what it predicts the XRP price will be by the end of 2026, and the chatbot gave a very bullish answer su...

ETH Leads the RWA Boom, But Can It Break Its Last Cycle High?
Ethereum might be down by 3% today, but the news that actually matters isn’t the price; it’s the $17.5 billion sitting on its rail...

MEXC Exchange’s Restricted and Supported Countries in 2026
MEXC is available in more than 170 countries and regions, but you cannot use it from the United States, Canada, the United Kingdom...

XRP News: Smart Money Is Behind Billions in ETF Inflows
XRP is experiencing turbulence along with the whole market, but the price action is masking one of the more telling institutional...