Dogecoin Holds Strong Support: DOGE Primed for a Major Move Higher!
Dogecoin is moving higher above the $0.160 resistance zone against the US Dollar. DOGE is holding gains and might aim for a move above $0.1650. DOGE price is moving higher above the $0.160 resistance zone. The price is t...

Dogecoin is moving higher above the $0.160 resistance zone against the US Dollar. DOGE is holding gains and might aim for a move above $0.1650.
- DOGE price is moving higher above the $0.160 resistance zone.
- The price is trading above the $0.160 level and the 100-hourly simple moving average.
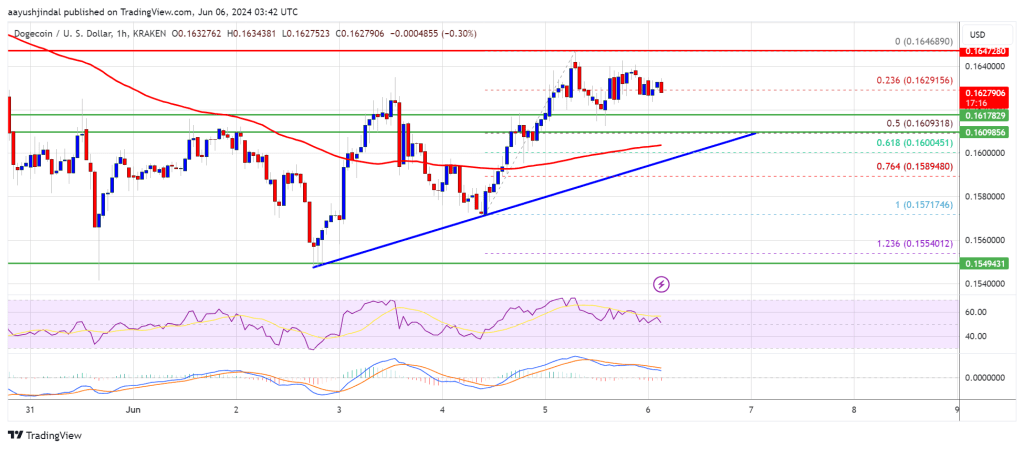
- There is a key bullish trend line forming with support near $0.160 on the hourly chart of the DOGE/USD pair (data source from Kraken).
- The price must settle above $0.1650 to gain bullish momentum and continue higher.
In the past few sessions, Dogecoin price started a steady increase above the $0.1500 zone, like Bitcoin and Ethereum. DOGE bulls were able to push the price above the $0.160 resistance zone.
The recent swing high was formed at $0.1646 before the price started a downside correction There was a drop below the $0.1620 support zone. The price spiked below the 23.6% Fib retracement level of the upward move from the $0.1571 swing low to the $0.1646 high.
Dogecoin is now trading above the $0.160 level and the 100-hourly simple moving average. There is also a key bullish trend line forming with support near $0.160 on the hourly chart of the DOGE/USD pair.
On the upside, the price is facing resistance near the $0.1640 level. The next major resistance is near the $0.1650 level. A close above the $0.1650 resistance might send the price toward the $0.1720 resistance. Any more gains might send the price toward the $0.1750 level. The next major stop for the bulls might be $0.1800.
Downside Correction In DOGE?If DOGE’s price fails to gain pace above the $0.1650 level, it could start another decline. Initial support on the downside is near the $0.160 level and the trend line. It is close to the 50% Fib retracement level of the upward move from the $0.1571 swing low to the $0.1646 high.
The next major support is near the $0.1580 level. If there is a downside break below the $0.1580 support, the price could decline further. In the stated case, the price might decline toward the $0.1520 level.
Technical Indicators
Hourly MACD – The MACD for DOGE/USD is now losing momentum in the bullish zone.
Hourly RSI (Relative Strength Index) – The RSI for DOGE/USD is now above the 50 level.
Major Support Levels – $0.1620, $0.1600 and $0.1580.
Major Resistance Levels – $0.1640, $0.1650, and $0.1720.
Original source
Read on NewsBTCRelated market context

Uranium Holds Above $85 as Mining ETF Rebounds From June Sell-Off
The latest charts display that the market is divided into stable physical prices and uranium shares trying to regain momentum afte...

Standard Chartered Says Bitcoin Bottomed Near $59,000 As Crypto Winter Ends
TL;DR Standard Chartered’s Geoffrey Kendrick reportedly says Bitcoin’s $59,000 area marked the cycle bottom. The note cites SpaceX...

Bitcoin price challenges $64,000 weekend wall – needing a breakout or risk a deeper correction
Bitcoin reclaimed $64,000 on June 12 and touched an intraday high of $64,301 in the same session that spot ETF flows finally flipp...

Bitcoin rises above $64,000 after Pakistan prime minister says Iran peace deal is near
Bitcoin traded above $64,000 on Saturday, supported by its strongest ETF inflows in a month and growing optimism around geopolitic...

Elon Musk’s trillionaire status puts his net worth above crypto’s entire market cap outside Bitcoin
Elon Musk has become the first person in modern history to amass a personal net worth exceeding $1 trillion, crossing the historic...

Google Gemini AI Predicts Jaw-Dropping XRP Price For Next 90 Days
Google Gemini AI just put XRP back under the spotlight, predicting it is tightly wound for a major breakout toward $1.60 to $1.80...