Dogecoin Inverted Scale Shows A Sharp Drop, But Something Is Interesting About This Chart
A monthly chart of Dogecoin shows a brutal pattern of repeated rejections and cascading drops that looks grim at first glance. Crypto analyst Trader Tardigrade laid out a decade-long structure in which the Dogecoin price...
Archive context
Older archive item. Useful for background and entity history, but not a fresh market-moving signal.

A monthly chart of Dogecoin shows a brutal pattern of repeated rejections and cascading drops that looks grim at first glance.
Crypto analyst Trader Tardigrade laid out a decade-long structure in which the Dogecoin price has been hammered at critical resistance three separate times, triggering a massive plunge on each occasion. The 2026 rejection is now in place, and the analyst sees a third repeat of the same devastating sequence. However, the chart has a twist that changes everything.
Dogecoin Gets Hammered On An Inverted Monthly ChartTrader Tardigrade’s chart shows DOGE/USD on the monthly timeframe, but the price scale is flipped. This means the lower the chart moves, the higher Dogecoin is moving in normal market price. The red descending line designated as a critical resistance is therefore not a bearish ceiling in the usual sense. It is a resistance line on an inverted chart, and a rejection from it sends the price downward.
As shown on the chart, Dogecoin couldn’t break through and got sent straight back down below the level. However, considering this is inverted, what it actually means is that Dogecoin is bouncing on a support trendline. A drop on the inverted scale would translate into a rally in DOGE’s real price.
The analyst pointed to three major moments when Dogecoin touched this inverted resistance and failed to break through. The first came around the 2017 cycle, the second around the 2021 cycle, and the third is being presented as the current 2026 setup. In each previous case, the rejection was followed by a large move downward on the inverted chart, which means a large rally upward on the normal Dogecoin chart.
Dogecoin Price Chart. Source: @TATrader_Alan On X
What’s Next For Dogecoin?“This drop is coming,” the analyst said. However, the drop being referenced is not a normal Dogecoin price crash. It is a drop on the inverted chart. In normal terms, that means the Dogecoin price would be rising. The chart’s projection even points to double-digit price levels if the historical drops on the inverted chart repeats itself.
That target is extreme compared to Dogecoin’s current price around $0.108. A move to $1 would require DOGE to rise by more than 825% from current levels, while a move to $10 would require a rally of more than 9,000%. However, the projection on the chart shows the Dogecoin price going to as high as $23. This is why the chart should be read as a long-term setup.
Speaking of price action, Dogecoin is actually showing signs of a bounce from support. DOGE reached as high as $0.11 in the past 24 hours, and it is currently up by about 10% in a seven-day timeframe. Interestingly, Dogecoin futures open interest is exploding and is now at its highest level of the year.
Featured image from Pexels, chart from TradingView
Why this matters
Dogecoin is showing up inside the Memecoins theme, so this story is worth tracking for follow-through rather than treating it as a one-off headline.
Original source
Read on NewsBTCRelated market context

CleanCore’s $800M AI Contract Shows Dogecoin Treasury Firms Are Changing Shape
CleanCore Solutions has signed a 10-year colocation agreement with Cerebras Systems valued at $800 million, and the story is not j...
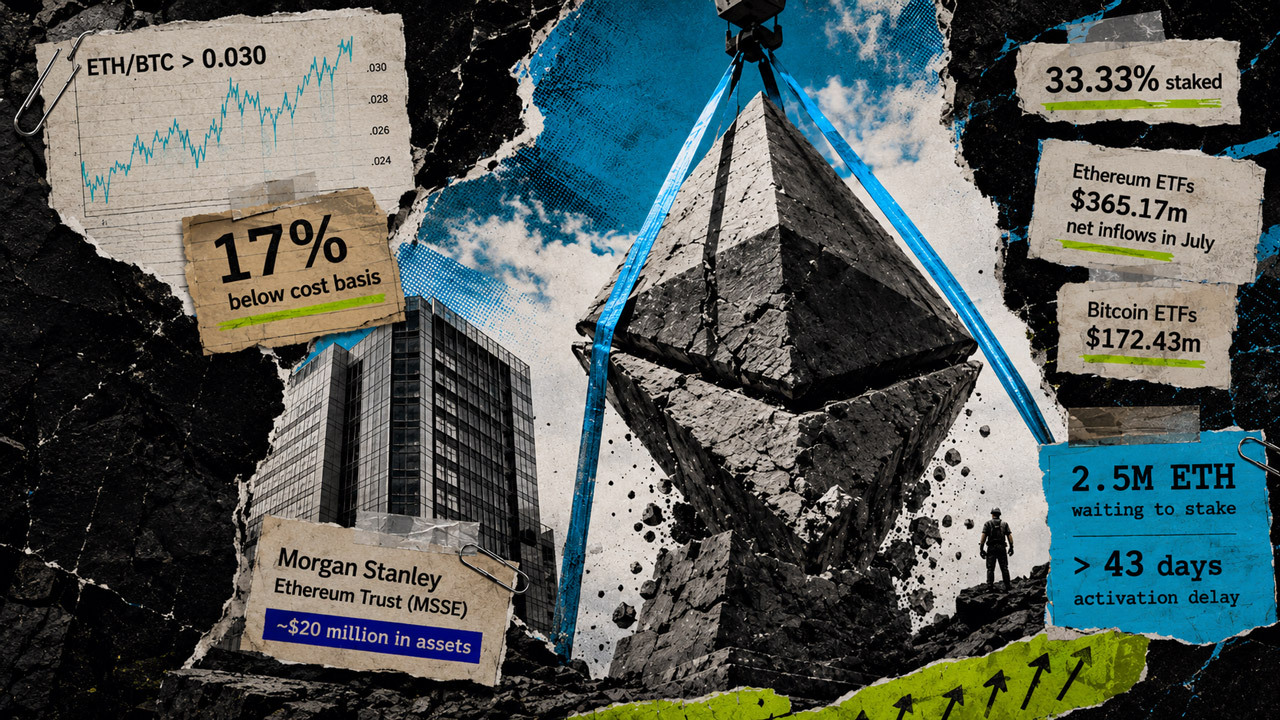
Ethereum just outpaced Bitcoin with $365 million in ETF inflows, but on-chain data shows the real bottom isn’t in yet
Ethereum outpaced Bitcoin in July as stronger investment-product demand and corporate accumulation powered its first sustained rel...

Trump Crypto Empire Under Fire After Poll Shows Majority Disapprove
The political heat around Donald Trump’s crypto holdings is translating into pressure across politically linked digital assets. Th...

Analyst: Bitcoin Drops to $60K in August Before Rebounding to $70K
Andrey Poroshin, a financial analyst at Bitbanker, an exchange with a presence in Russia, the UAE, and Kyrgyzstan, stresses that b...

Ethereum (ETH) Price Prediction: $2,000 or $1,680 Next as ETH Reaches a Critical Turning Point
Ethereum price has fallen back below $1,900 after buyers failed to maintain the latest recovery, leaving ETH positioned between an...

New Bitcoin study shows the strongest recurring liquidation warning signs cannot warn of an individual crash
A new arXiv preprint studying seven major Bitcoin crashes found the warning signal shifting among price, leverage, and order flow...