Dogecoin Open Interest Plunges 58%: How Do Shiba Inu & Pepe Compare?
Data shows the Dogecoin Open Interest has seen a large drop recently. Here’s how the trend has compared for Shiba Inu and other memecoins. Dogecoin Has Witnessed A Decline In Open Interest Recently In a new post on X, th...
Archive context
Older archive item. Useful for background and entity history, but not a fresh market-moving signal.
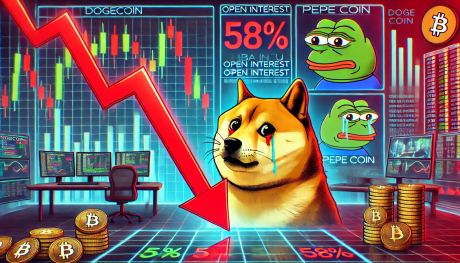
Data shows the Dogecoin Open Interest has seen a large drop recently. Here’s how the trend has compared for Shiba Inu and other memecoins.
Dogecoin Has Witnessed A Decline In Open Interest RecentlyIn a new post on X, the analytics firm Glassnode has discussed about the latest trend in the Open Interest for the various memecoins in the cryptocurrency sector.
The “Open Interest” here refers to an indicator that keeps track of the total amount of positions related to a given asset currently open on all derivatives exchanges.
First, here is a chart that shows the trend in the 7-day moving average (MA) of the metric for Dogecoin, the original meme-based token:
As is visible in the above graph, the 7-day MA of the Dogecoin Open Interest had a value of $3.5 billion in December, but since then, speculative interest around the asset has plummeted as it has come down to just $1.49 billion today. This represents a decrease of around 58.4%.
DOGE isn’t the only memecoin that has gone through a futures flush in this period, however, as the second chart shared by the analytics firm shows.
From the graph, it’s apparent that Pepe (PEPE), Bonk (BONK), and dogwifhat (WIF) have all seen a cooldown in Open Interest during the last couple of months. The decline has even been more pronounced than DOGE’s for all of these, as the metric has fallen by more than 69% for them.
Shiba Inu (SHIB) and Floki (FLOKI) have likewise followed suit, with the indicator declining by 74% and 69%, respectively.
While speculative activity on the futures market has taken the deep dive across the memecoins, it appears the trend has been different for other parts of the cryptocurrency sector.
Here is a chart that the analytics firm has shared in another X post, which shows how the percentage change in the Open Interest has compared between meme-based assets and three of the top coins (Bitcoin (BTC), Ethereum (ETH), and Solana (SOL)):
As displayed in the above graph, Bitcoin, Ethereum, and Solana have registered a drop of 11%, 23%, and 6% on the metric, respectively. Clearly, this is significantly less than the 52% crash that the memecoin market combined has observed.
DOGE PriceDogecoin has been locked in sideways movement during the last couple of weeks as its price is still trading around $0.25.
Why this matters
This altcoin story adds another data point to the current market tape and is useful when read alongside nearby source coverage.
Original source
Read on NewsBTCRelated market context
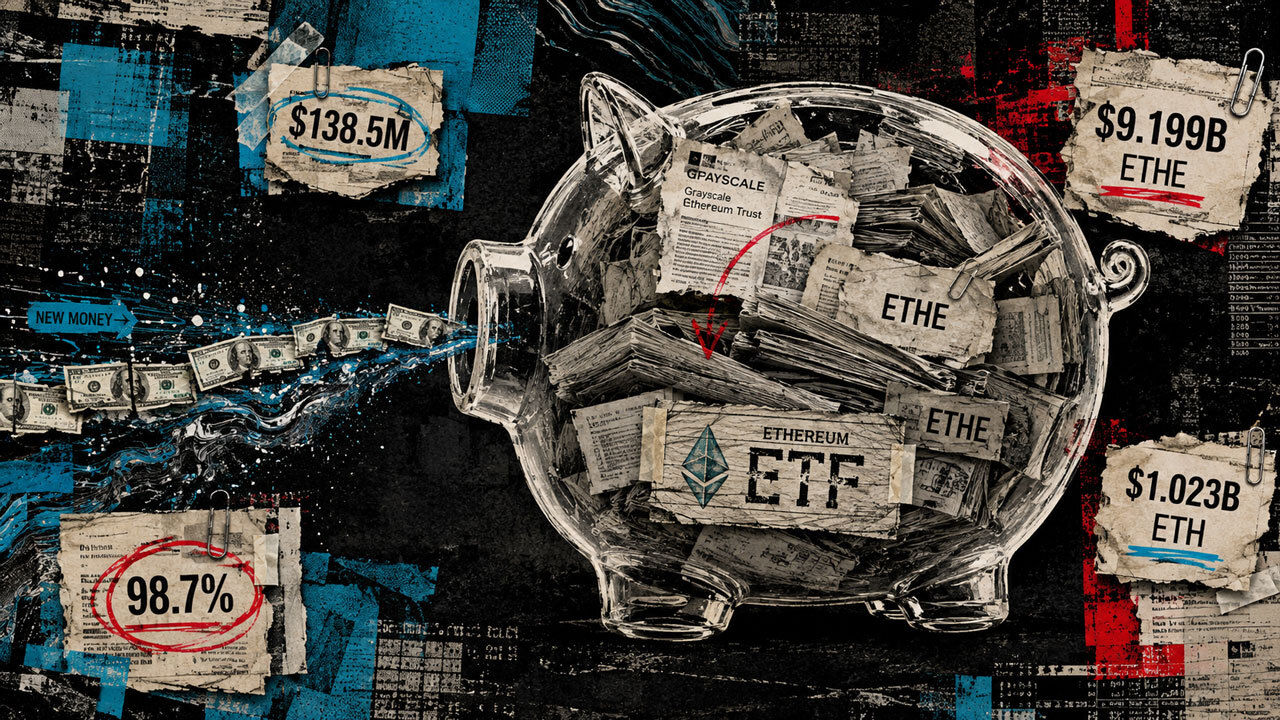
Crypto ETFs appeared to hit $10B in hours, but filing data exposes where that money really came from
US spot Ethereum ETFs appeared to begin trading with $10.36 billion already inside them, an opening balance large enough to resemb...

Coinbase’s $104M US500 trading spike hits an early reality check
Coinbase US500 futures reached a $100 million milestone, giving the exchange an early test of whether a crypto-native trading mech...
Debasement Trade Is Here Thanks to Government Debt — And Bitcoin Will Benefit: Grayscale
Bitcoin Magazine Debasement Trade Is Here Thanks to Government Debt — And Bitcoin Will Benefit: Grayscale The debasement trade is...

Ethereum Price Faces Glamsterdam Test as 3X Network Speed Threatens Smart Contracts
Ethereum price is starting to stabilize, as the network’s next major upgrade puts its core economic assumptions under scrutiny. Th...
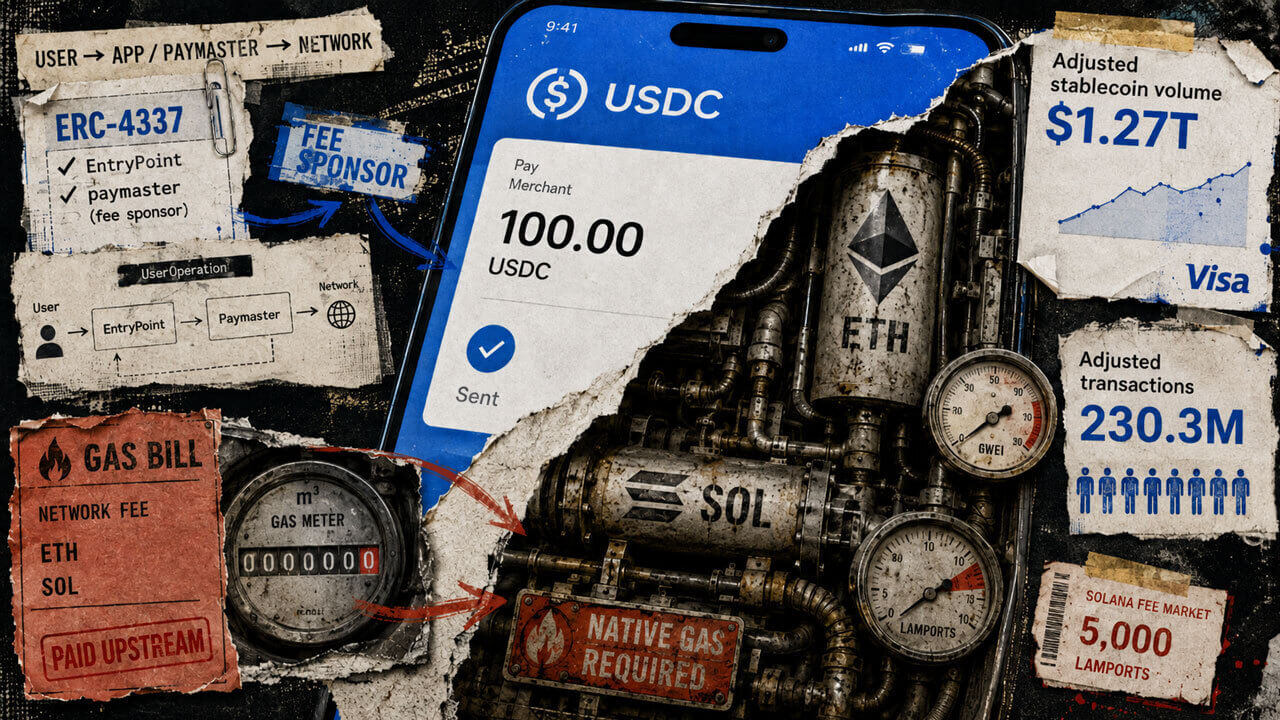
Ethereum and Solana are hosting trillions in dollar volume, yet their native tokens risk losing direct consumer demand
Matt Corallo followed up on an earlier post on Aug. 25, addressing what stablecoin users increasingly see: apps routing around ETH...

Sui (SUI) Price Prediction: ETF Inflows and 100MA Support Strengthen $1.15 Outlook
Recent SUI price action has focused attention on the $0.73-$0.76 area, where several short- and medium-term moving averages are pr...