Dogecoin Price (DOGE) Bulls Target $0.15 Breakout: Can They Succeed?
Dogecoin started a steady increase above the $0.1320 resistance zone against the US Dollar. DOGE is consolidating and might extend its gains above $0.150. DOGE price is eyeing more gains above the $0.150 resistance zone....

Dogecoin started a steady increase above the $0.1320 resistance zone against the US Dollar. DOGE is consolidating and might extend its gains above $0.150.
- DOGE price is eyeing more gains above the $0.150 resistance zone.
- The price is trading above the $0.1320 level and the 100-hourly simple moving average.
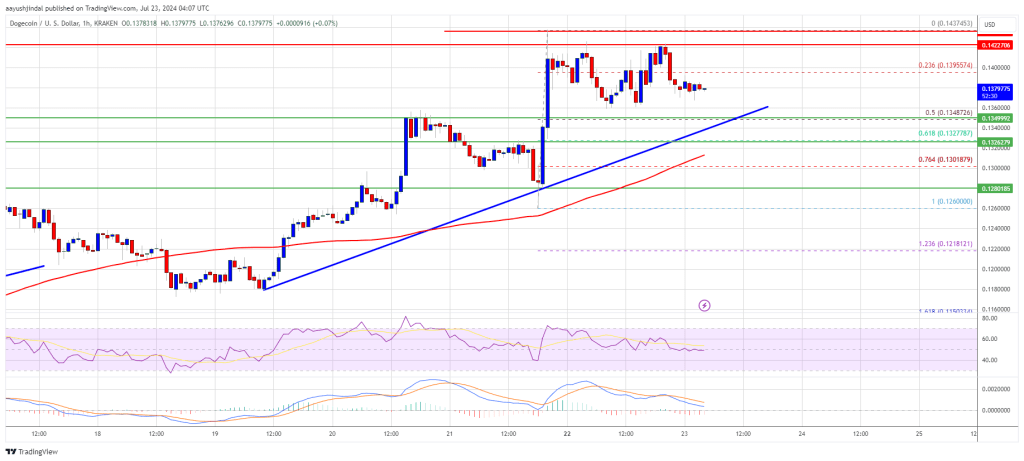
- There is a key bullish trend line forming with support at $0.1345 on the hourly chart of the DOGE/USD pair (data source from Kraken).
- The price could continue to move up if it clears the $0.1420 resistance zone.
In the past few days, Dogecoin price saw a decent increase above the $0.1150 level. DOGE cleared the $0.1250 resistance to move into a positive zone like Bitcoin and Ethereum. The price even climbed above the $0.1320 level and the 100-hourly simple moving average.
A high was formed at $0.1437 and the price is now consolidating gains. There was a minor decline below the $0.140 level. The price dipped below the 23.6% Fib retracement level of the upward move from the $0.1260 swing low to the $0.1437 high.
Dogecoin is now trading above the $0.1320 level and the 100-hourly simple moving average. There is also a key bullish trend line forming with support at $0.1345 on the hourly chart of the DOGE/USD pair. The trend line is close to the 50% Fib retracement level of the upward move from the $0.1260 swing low to the $0.1437 high.
If there is a fresh increase, the price might face resistance near the $0.1420 level. The next major resistance is near the $0.1450 level. A close above the $0.1450 resistance might send the price toward the $0.150 resistance. Any more gains might send the price toward the $0.1650 level. The next major stop for the bulls might be $0.1720.
Are Dips Supported In DOGE?If DOGE’s price fails to gain pace above the $0.1420 level, it could start a downside correction. Initial support on the downside is near the $0.1365 level. The next major support is near the $0.1320 level.
The main support sits at $0.1280. If there is a downside break below the $0.1280 support, the price could decline further. In the stated case, the price might decline toward the $0.1150 level.
Technical Indicators
Hourly MACD – The MACD for DOGE/USD is now gaining momentum in the bullish zone.
Hourly RSI (Relative Strength Index) – The RSI for DOGE/USD is now above the 50 level.
Major Support Levels – $0.1365 and $0.1320.
Major Resistance Levels – $0.1420 and $0.1500.
Original source
Read on NewsBTCRelated market context

Uranium Holds Above $85 as Mining ETF Rebounds From June Sell-Off
The latest charts display that the market is divided into stable physical prices and uranium shares trying to regain momentum afte...

Elon Musk’s trillionaire status puts his net worth above crypto’s entire market cap outside Bitcoin
Elon Musk has become the first person in modern history to amass a personal net worth exceeding $1 trillion, crossing the historic...

Google Gemini AI Predicts Jaw-Dropping XRP Price For Next 90 Days
Google Gemini AI just put XRP back under the spotlight, predicting it is tightly wound for a major breakout toward $1.60 to $1.80...

Tether USDT Briefly Overtakes Ethereum in Market Cap: A $187B Wake-Up Call
For a few hours, earlier this week, Tether USDT stablecoin held a higher market cap than Ethereum, the first time that has happene...

Bitcoin price challenges $64,000 weekend wall – needing a breakout or risk a deeper correction
Bitcoin reclaimed $64,000 on June 12 and touched an intraday high of $64,301 in the same session that spot ETF flows finally flipp...

Elon Musk SpaceX AI Predicts Incredible Bitcoin Price For Next 30 Days
Here is the thing about capitulation calls. They only sound smart in hindsight. Right now, with Bitcoin price scraping along the l...