Dogecoin Price (DOGE) Poised for a Steady Increase, Inspired by Bitcoin
Dogecoin started a decent increase above the $0.0950 resistance against the US Dollar. DOGE is showing positive signs and might aim for a move above $0.1080. DOGE price is gaining pace above the $0.100 pivot zone. The pr...

Dogecoin started a decent increase above the $0.0950 resistance against the US Dollar. DOGE is showing positive signs and might aim for a move above $0.1080.
- DOGE price is gaining pace above the $0.100 pivot zone.
- The price is trading above the $0.100 level and the 100-hourly simple moving average.
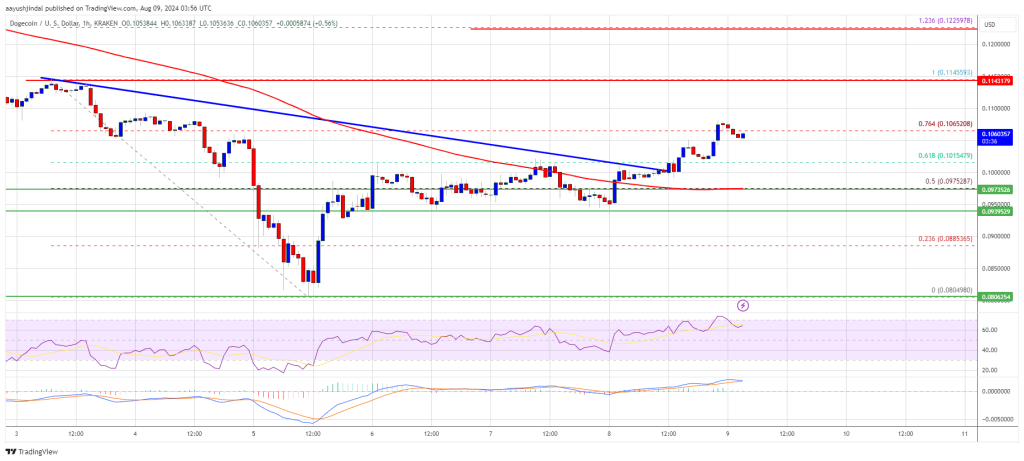
- There was a break above a key bearish trend line with resistance at $0.1000 on the hourly chart of the DOGE/USD pair (data source from Kraken).
- The price could continue to move up if it clears the $0.1100 resistance zone.
In the past few sessions, Dogecoin price saw a decent increase above $0.090 like Bitcoin and Ethereum. The price was able to clear the $0.0945 and $0.0950 resistance levels.
It cleared the 50% Fib retracement level of the downward move from the $0.1145 swing high to the $0.0804 low. Besides, there was a break above a key bearish trend line with resistance at $0.1000 on the hourly chart of the DOGE/USD pair.
Dogecoin is now trading above the $0.100 level and the 100-hourly simple moving average. However, the bears seem to be active near the 76.4% Fib retracement level of the downward move from the $0.1145 swing high to the $0.0804 low.
Immediate resistance on the upside is near the $0.1080 level. The next major resistance is near the $0.1100 level. A close above the $0.1100 resistance might send the price toward the $0.1145 resistance. Any more gains might send the price toward the $0.1220 level. The next major stop for the bulls might be $0.1250.
Another Decline In DOGE?If DOGE’s price fails to recover above the $0.1100 level, it could start another decline. Initial support on the downside is near the $0.100 level. The next major support is near the $0.0980 level and the 100-hourly simple moving average.
The main support sits at $0.0950. If there is a downside break below the $0.0950 support, the price could decline further. In the stated case, the price might decline toward the $0.0900 level or even $0.0880 in the near term.
Technical Indicators
Hourly MACD – The MACD for DOGE/USD is now gaining momentum in the bullish zone.
Hourly RSI (Relative Strength Index) – The RSI for DOGE/USD is now above the 50 level.
Major Support Levels – $0.1000 and $0.0950.
Major Resistance Levels – $0.1100 and $0.1145.
Original source
Read on NewsBTCRelated market context

Uranium Holds Above $85 as Mining ETF Rebounds From June Sell-Off
The latest charts display that the market is divided into stable physical prices and uranium shares trying to regain momentum afte...

Bitcoin rises above $64,000 after Pakistan prime minister says Iran peace deal is near
Bitcoin traded above $64,000 on Saturday, supported by its strongest ETF inflows in a month and growing optimism around geopolitic...

Standard Chartered Says Bitcoin Bottomed Near $59,000 As Crypto Winter Ends
TL;DR Standard Chartered’s Geoffrey Kendrick reportedly says Bitcoin’s $59,000 area marked the cycle bottom. The note cites SpaceX...

Bitcoin price challenges $64,000 weekend wall – needing a breakout or risk a deeper correction
Bitcoin reclaimed $64,000 on June 12 and touched an intraday high of $64,301 in the same session that spot ETF flows finally flipp...

Bitcoin price faces new risk as big buyers lose conviction
Bitcoin’s largest buyers are no longer behaving like a reliable backstop for the largest cryptocurrency. The exchange-traded funds...

Google Gemini AI Predicts Jaw-Dropping XRP Price For Next 90 Days
Google Gemini AI just put XRP back under the spotlight, predicting it is tightly wound for a major breakout toward $1.60 to $1.80...