Dogecoin Price (DOGE) Struggles: Can It Overcome the Slump?
Dogecoin extended losses and traded below $0.100 against the US Dollar. DOGE is struggling and might face challenges near $0.100 and $0.1050. DOGE price started a fresh decline and traded below $0.0980. The price is trad...

Dogecoin extended losses and traded below $0.100 against the US Dollar. DOGE is struggling and might face challenges near $0.100 and $0.1050.
- DOGE price started a fresh decline and traded below $0.0980.
- The price is trading below the $0.0980 level and the 100-hourly simple moving average.
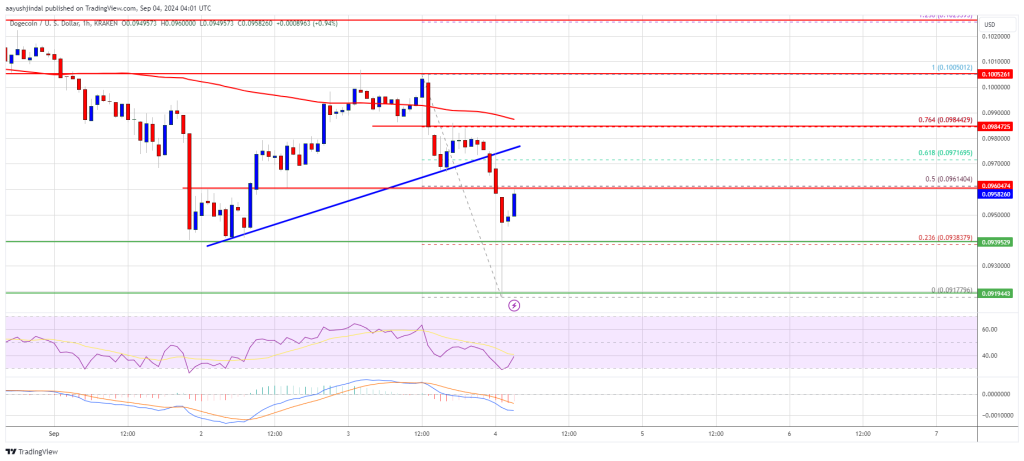
- There was a break below a connecting bullish trend line with support at $0.0975 on the hourly chart of the DOGE/USD pair (data source from Kraken).
- The price could start a recovery wave if it clears the $0.100 and $0.1050 levels.
In the past few sessions, Dogecoin price saw a fresh decline below the $0.100 level like Bitcoin and Ethereum. The price traded below the $0.0980 level to move further in a bearish zone.
There was a spike below the $0.0920 level. A low was formed at $0.0917 and the price is now attempting a recovery wave. There was a minor increase above the $0.0950 level. The price climbed above the 23.6% Fib retracement level of the downward move from the $0.1005 swing high to the $0.0917 low.
Dogecoin price is now trading below the $0.100 level and the 100-hourly simple moving average. Immediate resistance on the upside is near the $0.0962 level or the 50% Fib retracement level of the downward move from the $0.1005 swing high to the $0.0917 low.
The next major resistance is near the $0.0985 level. A close above the $0.0985 resistance might send the price toward the $0.100 resistance. Any more gains might send the price toward the $0.1050 level. The next major stop for the bulls might be $0.1120.
Another Decline In DOGE?If DOGE’s price fails to climb above the $0.0985 level, it could start another decline. Initial support on the downside is near the $0.0940 level. The next major support is near the $0.0920 level.
The main support sits at $0.090. If there is a downside break below the $0.0900 support, the price could decline further. In the stated case, the price might decline toward the $0.0862 level or even $0.0850 in the near term.
Technical Indicators
Hourly MACD – The MACD for DOGE/USD is now losing momentum in the bearish zone.
Hourly RSI (Relative Strength Index) – The RSI for DOGE/USD is now below the 50 level.
Major Support Levels – $0.0940 and $0.0920.
Major Resistance Levels – $0.0985 and $0.1000.
Original source
Read on NewsBTCRelated market context

US forces shoot down Iranian attack drones near Strait of Hormuz, Bitcoin drops below $73K
Geopolitical tensions near vital oil routes can destabilize financial markets, highlighting the interconnectedness of global secur...

Standard Chartered Says Bitcoin Bottomed Near $59,000 As Crypto Winter Ends
TL;DR Standard Chartered’s Geoffrey Kendrick reportedly says Bitcoin’s $59,000 area marked the cycle bottom. The note cites SpaceX...

Bitcoin price faces new risk as big buyers lose conviction
Bitcoin’s largest buyers are no longer behaving like a reliable backstop for the largest cryptocurrency. The exchange-traded funds...

Elon Musk’s trillionaire status puts his net worth above crypto’s entire market cap outside Bitcoin
Elon Musk has become the first person in modern history to amass a personal net worth exceeding $1 trillion, crossing the historic...

Uranium Holds Above $85 as Mining ETF Rebounds From June Sell-Off
The latest charts display that the market is divided into stable physical prices and uranium shares trying to regain momentum afte...

Tether USDT Briefly Overtakes Ethereum in Market Cap: A $187B Wake-Up Call
For a few hours, earlier this week, Tether USDT stablecoin held a higher market cap than Ethereum, the first time that has happene...