Dogecoin Price Prediction: Doge Hits Bearish Circuit and Could Drop To $0.07
Dogecoin started a fresh decline from $0.0820 against the US Dollar. DOGE is declining and might drop toward the $0.065 support zone. DOGE failed to clear $0.0820 and started a fresh decline against the US dollar. The pr...
Archive context
Older archive item. Useful for background and entity history, but not a fresh market-moving signal.

Dogecoin started a fresh decline from $0.0820 against the US Dollar. DOGE is declining and might drop toward the $0.065 support zone.
- DOGE failed to clear $0.0820 and started a fresh decline against the US dollar.
- The price is trading below the $0.080 zone and the 100 simple moving average (4 hours).
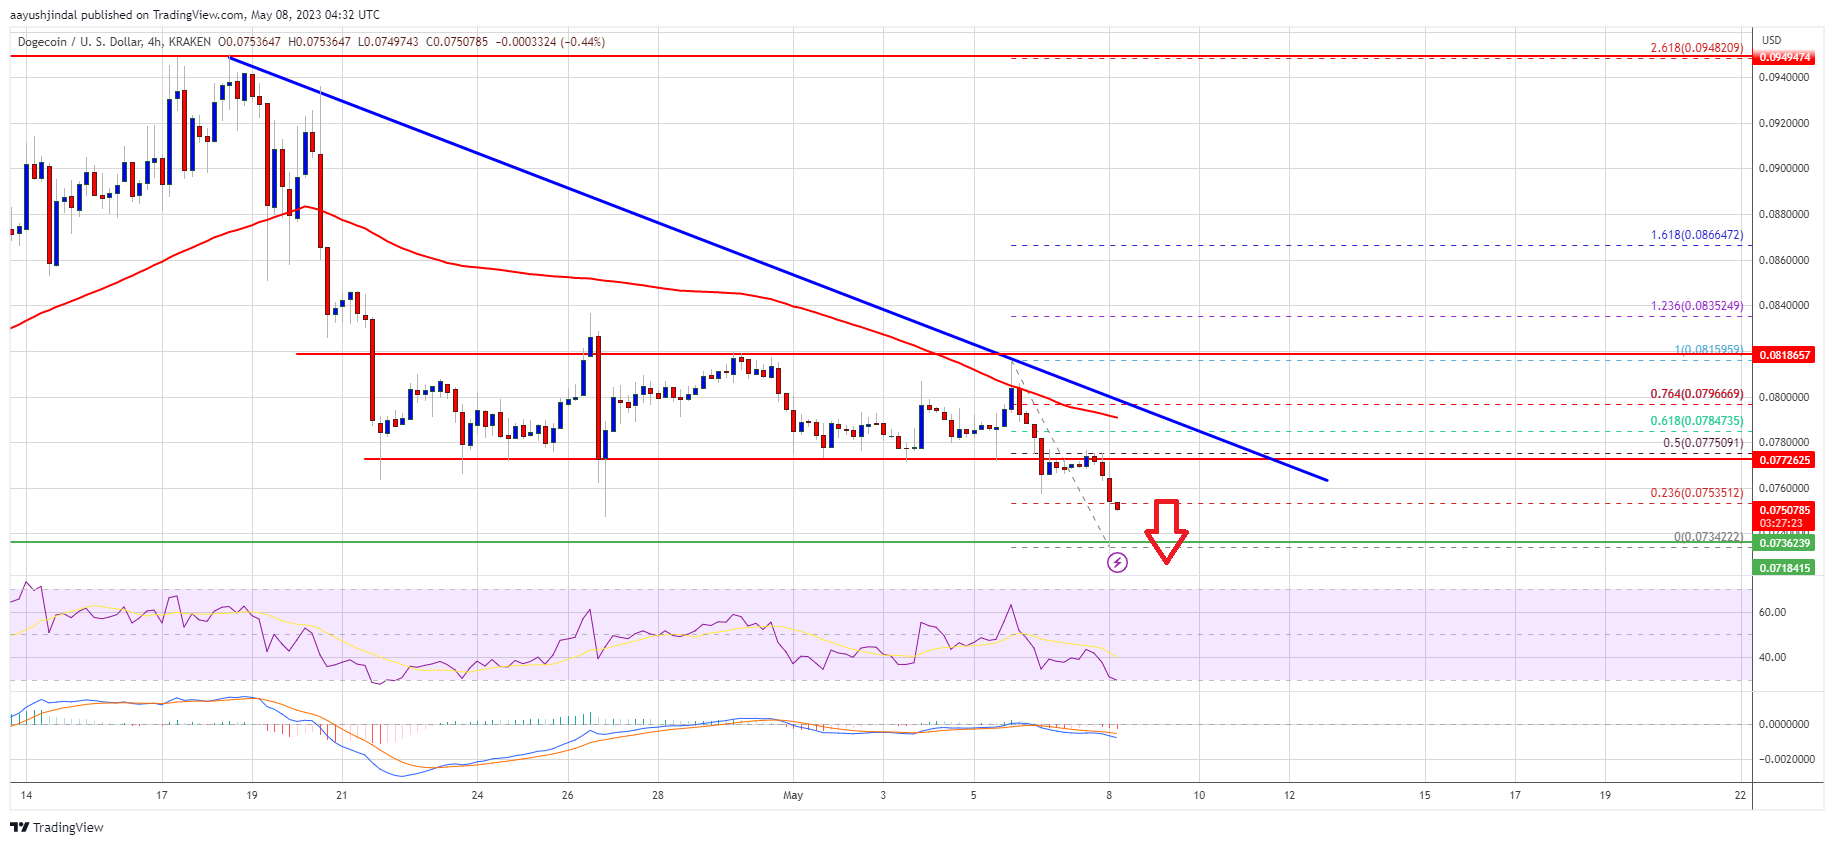
- There is a key bearish trend line forming with resistance near $0.078 on the 4-hours chart of the DOGE/USD pair (data source from Kraken).
- The pair could decline further if there is a move below $0.0720.
After a minor increase, Dogecoin’s price faced resistance near $0.0820. DOGE formed a high near $0.0815 and started a fresh decline, similar to Bitcoin and Ethereum.
There was a clear move below the $0.0800 support and the 100 simple moving average (4 hours). The bears were able to push the price below the key support at $0.0775. A low is formed near $0.0734 and the price is now showing bearish signs.
DOGE is trading below the $0.080 zone and the 100 simple moving average (4 hours). There is also a key bearish trend line forming with resistance near $0.078 on the 4-hours chart of the DOGE/USD pair.
On the upside, the price is facing resistance near the $0.0775 level. It is close to the 50% Fib retracement level of the recent decline from the $0.0815 swing high to the $0.0734 low. The next major resistance is near the $0.078 zone and the trend line.
Source: DOGEUSD on TradingView.com
The trend line is close to the 100 simple moving average (4 hours) and the 61.8% Fib retracement level of the recent decline from the $0.0815 swing high to the $0.0734 low. A close above the $0.078 resistance might send the price toward the $0.082 resistance. The next major resistance is near $0.0850. Any more gains might send the price toward the $0.090 level.
More Losses in DOGE?If DOGE’s price fails to gain pace above the $0.078 level, it could continue to move down. Initial support on the downside is near the $0.0735 level.
The next major support is near the $0.0720 level. If there is a downside break below the $0.072 support, the price could decline further. In the stated case, the price might decline toward the $0.070 level.
Technical Indicators
4 Hours MACD – The MACD for DOGE/USD is now gaining momentum in the bearish zone.
4 Hours RSI (Relative Strength Index) – The RSI for DOGE/USD is now below the 50 level.
Major Support Levels – $0.0735, $0.072, and $0.070.
Major Resistance Levels – $0.0775, $0.0780, and $0.082.
Why this matters
This altcoin story adds another data point to the current market tape and is useful when read alongside nearby source coverage.
Original source
Read on NewsBTCRelated market context

Ethereum (ETH) Price Prediction: ETH Holds Near $1,780 as Bulls Eye $1,860–$1,950, but $1,609 Remains Key Invalidation
Ethereum price is trading near $1,779 after a mixed 24-hour session, according to Brave New Coin data. ETH is down around 0.76% on...

Bitcoin (BTC) Price Prediction: BTC Holds $63K Support—Can Rising Active Addresses Offset Bearish Technical Signals?
Although the BTC price has remained near a key support zone, recent chart signals and Strategy’s sale of a portion of its Bitcoin...

Vitalik Buterin Says Ethereum’s Next Major Upgrade Will Take Three to Four Years and Rival the Merge
Ethereum co-founder Vitalik Buterin says the network’s next major overhaul, an initiative researchers are calling “Lean Ethereum,”...

Ethereum Price Prediction: Vitalik Hints at 3-4 Years Long ETH Rebuild
Ethereum price is trading at $1,780 as Vitalik Buterin revealed the network’s biggest roadmap since the Merge, which somehow sends...

Ethereum plans major upgrade with “Lean Ethereum” redesign, Buterin reveals
Ethereum's strategic shift towards enhanced scalability and security could reshape market perceptions, influencing its long-term v...

Vitalik’s new Lean Ethereum plan puts ETH’s Wall Street pitch on a 4 year clock
Vitalik Buterin's July 4 Lean Ethereum post put a clock on ETH's institutional story: a protocol pitched as financial infrastructu...