Dogecoin Rally On Thin Ice: Analyst Predicts Sudden Shakeout
Dogecoin begins the new trading week in an unusually precarious spot on its higher‑time‑frame chart: technically triumphant, yet visibly stretched. A cluster of weekly studies shared by pseudonymous market technician Can...
Archive context
Older archive item. Useful for background and entity history, but not a fresh market-moving signal.

Dogecoin begins the new trading week in an unusually precarious spot on its higher‑time‑frame chart: technically triumphant, yet visibly stretched. A cluster of weekly studies shared by pseudonymous market technician Cantonese Cat shows the meme‑coin pressing into resistance after an abrupt two‑week rally that added roughly 80 percent from the June lows. The analyst cautions that the move, though structurally bullish, may require a brief pullback to consolidate before further gains.
Dogecoin Overextended?On the logarithmic Fibonacci retracement drawn across the 2024–25 range, last week’s candle managed to close marginally above the 0.618 level at $0.262 — a zone that has capped every breakout attempt since January. The close was technically significant: in classical market geometry, recapturing the 61.8 percent retrace often signals a transition from recovery to trend expansion.
“It broke above the 0.618 log fib which can use a bullish back‑test,” Cantonese Cat observed, adding that a return to that same area “would flush back down to back‑test” the double‑bottom that formed around $0.15 earlier in the quarter.
The Bollinger‑Band panel underscores the risk of near‑term mean‑reversion. Dogecoin’s weekly close at $0.267 is the first in eleven months to settle outside the upper band, which currently sits near $0.262. Such closes are rare on a high‑time‑frame chart and are typically followed by at least one candle that re‑enters the bands.
“It’s above the Bollinger band,” the analyst notes. Historically, Dogecoin has struggled to maintain altitude when that spread becomes extreme, often retreating to the middle band — now near $0.19 — or, in stronger cycles, to the upper band itself on the subsequent week.
The Ichimoku snapshot tells a similar story of progress meeting inertia. Price has vaulted both the conversion line (Tenkan‑sen) and the baseline (Kijun‑sen), confirming bullish momentum on those metrics, but remains pinned beneath the underside of the weekly cloud. The Senkō Span B that defines that lower cloud boundary sits around $0.28–$0.29, almost exactly where Dogecoin stalled on the final trading day of last week.
Cantonese Cat labels that area “Ichimoku cloud resistance” and warns that until a decisive close pierces the cloud, the level should be treated as supply. A brief dip, therefore, would allow the Kijun‑sen (roughly $0.23) and the 0.618 Fibonacci level to compress into a confluence that could provide the next higher low.
Supporting that idea is the supply‑demand band highlighted in grey on the fourth chart. It spans approximately $0.24 to $0.25 and corresponds to the base of February’s breakdown range. In chart‑pattern terms, the area acts as the neckline of the double‑bottom Cantonese Cat references.
A retracement into that former resistance‑turned‑support could satisfy both the Fibonacci back‑test requirement and the Bollinger re‑entry, while leaving the broader reversal structure intact. The analyst sketches exactly that path on the chart: a pullback into the grey zone, followed by a renewed advance toward the mid‑$0.30s.
Importantly, none of these observations undermine the longer‑term shift in market structure. The double‑bottom around $0.15 resolved higher in July with a weekly candle that engulfed eleven weeks of prior supply, signalling a change of control from sellers to buyers. The most recent candles, though smaller, have held every gain from that breakout. As the analyst summarizes: “Overall, these are very bullish developments, even if it dips down early this week to reset some technicals.”
At press time, DOGE traded at $0.277.
Why this matters
This altcoin story adds another data point to the current market tape and is useful when read alongside nearby source coverage.
Original source
Read on NewsBTCRelated market context

Blackrock’s IBIT Sees $773 Million Weekly Exit as Bitcoin ETFs Lose $527 Million
Bitcoin and ether funds closed the week in the red for an eighth straight week. Altcoin ETFs, however, showed more resilience, wit...
Hyperliquid sets all-time high with $112M in weekly ETF inflows
Hyperliquid's ETF inflow surge highlights growing institutional interest in diversified crypto exposure, signaling potential marke...
Bitcoin Hits Highest Price in Weeks as Bernstein Analysts Maintain 'Ambitious' $150K Target
The financial firm admitted Bitcoin's retrace has been painful, but still holds a lofty year-end price prediction for the top cryp...

$60.4K Becomes 'most important area:' Five things to know in Bitcoin this week
Bitcoin saw its highest levels in nearly two weeks at the weekly close, but bulls needed a push beyond $65,000 for real trend infl...
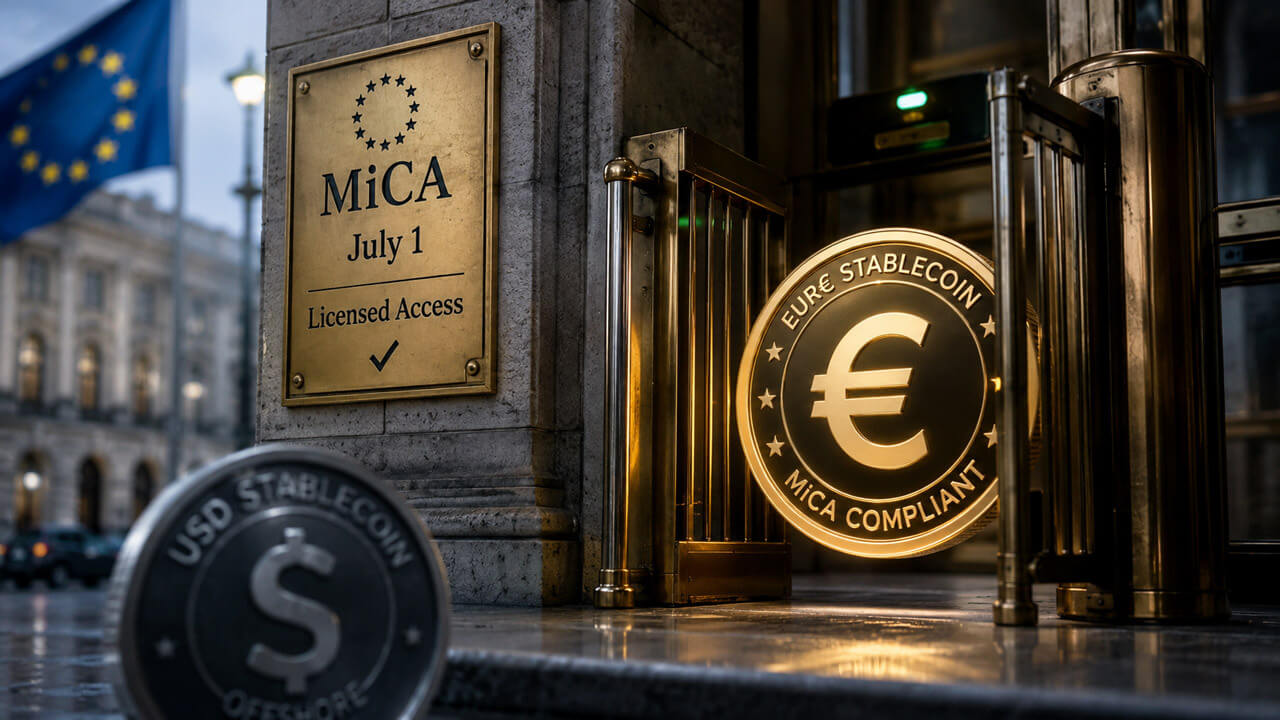
How MiCA brings banks closer to controlling Europe’s stablecoin access
Europe's MiCA deadline has now entered the phase in which licenses begin to shape distribution. The first wave of concern centered...

Strategy sells $216M Bitcoin, Bollinger bullish on BTC: Hodler's Digest, June 29-July 6, 2026
Bollinger Bands creator John Bollinger says the charts suggest Bitcoin could take off from here. Vitalik Buterin unveils a new Eth...