Dogecoin Ready For A $2.43 Rally? Elliott Wave Says Yes
A new chart shared by BigMike7335 (@Michael_EWpro) via X suggests that Dogecoin could be on the verge of a strong bullish wave targeting $2.43. His analysis relies on Elliott Wave theory, which divides market movements i...
Archive context
Older archive item. Useful for background and entity history, but not a fresh market-moving signal.

A new chart shared by BigMike7335 (@Michael_EWpro) via X suggests that Dogecoin could be on the verge of a strong bullish wave targeting $2.43. His analysis relies on Elliott Wave theory, which divides market movements into impulsive drives and corrective phases. According to this view, DOGE’s historic rally from about $0.0020 to its previous peak near $0.68 unfolded in five distinct waves, labeled as Wave 5(A). This run tracked key Fibonacci extension levels, including the 2.618 region around $0.14591 and the 3.618 near $0.68835, confirming a robust impulsive phase.
Wave C Could Take Dogecoin To $2.43Once DOGE reached its high around $0.68, the chart shows a significant multi-month period of consolidation that the analyst interprets as a W–X–Y corrective move, comprising Wave (B). This aligns with Elliott’s concept that once an impulsive five-wave sequence is completed, the market is likely to enter a corrective structure which can form in many shapes, including flats, zigzags, or more complex “double” and “triple” patterns such as the W–X–Y indicated here.
Throughout 2022 and well into 2023, Dogecoin’s price stayed in this corrective range, a phase that is also highlighted by the Ichimoku Cloud hovering above and around the price action. Traders often interpret the presence of the Ichimoku Cloud as a sign of sideways or uncertain momentum, which is exactly what a B-wave correction typically represents.
In November 2024, the Dogecoin broke above a descending trend line which capped price since the 2021 all-time high for more than 3.5 years. However, the momentum was lost in the following months. Since December, the chart reveals that Dogecoin has started to compress within a recognizable formation that could be viewed as a triangle or wedge.
This shape is often seen in markets as price moves closer to a point of equilibrium before eventually breaking out. The “top TL” (top trendline), which had previously acted as resistance during the decline, is now being watched closely as a potential level for a support/resistance flip. Big Mike noted that DOGE “looks like we are going to retest the top TL for a s/r flip,” implying that a successful hold above this trendline could confirm the end of the (B) wave and the start of the next impulsive phase.
In Elliott Wave terminology, if a five-wave impulsive move up is labeled (A) and the subsequent correction is labeled (B), then the next impulsive structure is typically labeled (C). In the shared chart, Big Mike projects that this Wave (C) could propel Dogecoin as high as $2.43, a figure that corresponds with another significant Fibonacci reference around $2.36 to $2.43. Traders and analysts often look to Fibonacci retracements and extensions to gauge potential support and resistance levels, and in Elliott Wave analysis, these ratios can help identify the possible end-points of larger waves.
The chart also points to $0.15247 as a key level below current trading prices. If DOGE sees a pullback to this area, it could confirm that the retest of the descending trendline is underway. A bounce off this level might signal that Wave (C) is beginning, whereas a break below it could invalidate or postpone the bullish scenario.
At press time, DOGE traded at $0.25.
Why this matters
This altcoin story adds another data point to the current market tape and is useful when read alongside nearby source coverage.
Original source
Read on NewsBTCRelated market context

Dogecoin (DOGE) Price Prediction: DOGE Holds Near $0.084 as $0.09 Breakout Could Open $0.115
Dogecoin is back in the spotlight as price slips towards the $0.084 area, putting an important support zone under pressure. The la...
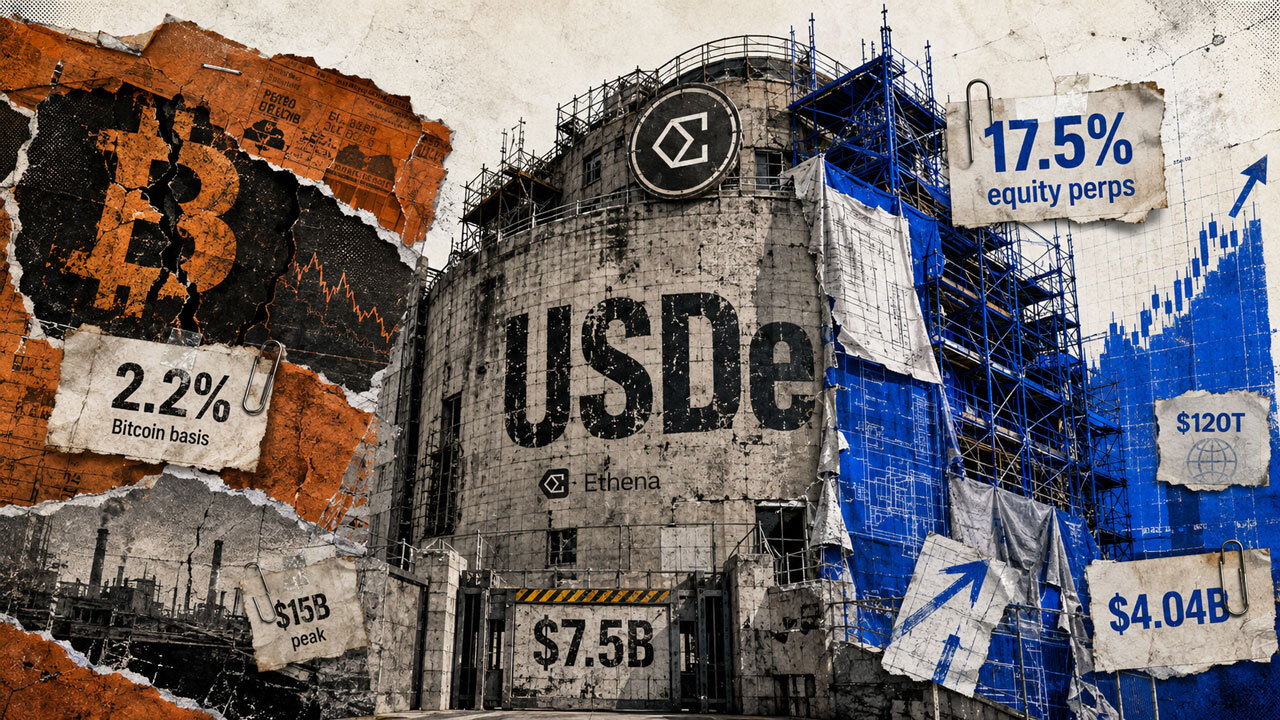
Ethena is targeting the $120 trillion Wall Street stock market to hunt yields 5x higher than Bitcoin
Ethena is expanding USDe into equity perpetual-basis trades, targeting funding yields more than five times higher than Bitcoin’s a...

Sui (SUI) Price Prediction: ETF Inflows and 100MA Support Strengthen $1.15 Outlook
Recent SUI price action has focused attention on the $0.73-$0.76 area, where several short- and medium-term moving averages are pr...

Aster launches USD1 RWA Boost Phase 1 with 125M WLFI tokens in rewards
Aster's initiative could significantly enhance liquidity and engagement in decentralized finance, potentially reshaping RWA market...

Bitcoin’s Oldest Coins Stir Again as 2026 Distribution Phase Nears Its End
Dormant bitcoin wallets from 2010-2017 are moving again in 2026, with $7.6bn spent from long-dormant addresses, but the Great Dist...
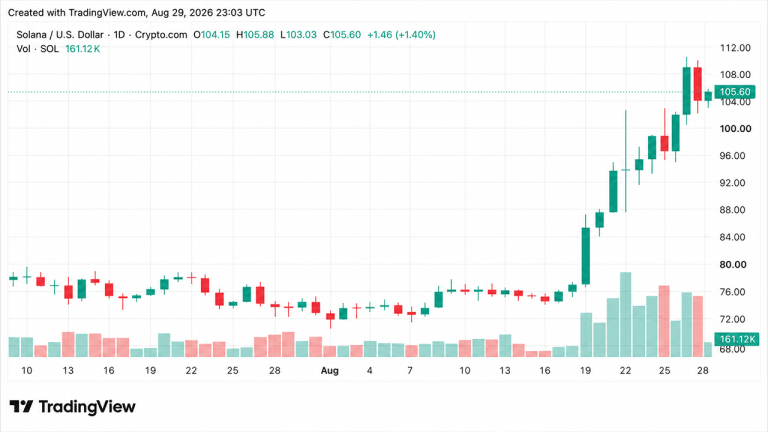
Crypto Weekly: Solana Leads Altcoin Gains as XRP and DOGE Slide
The crypto market cap ended the week flat at $2.73 trillion after volatile swings between $2.70 trillion and $2.79 trillion, contr...