Dogecoin Repeating History? This Setup Led To 150% Gains
A new technical chart shared by crypto analyst Cas Abbé (@cas_abbe) on X is showing a recurring bullish pattern in Dogecoin’s price action. The 3-day chart highlights three distinct descending channels in Dogecoin’s hist...
Archive context
Older archive item. Useful for background and entity history, but not a fresh market-moving signal.

A new technical chart shared by crypto analyst Cas Abbé (@cas_abbe) on X is showing a recurring bullish pattern in Dogecoin’s price action. The 3-day chart highlights three distinct descending channels in Dogecoin’s history—one during Q4 2023, another in Q3 2024, and the current one in early 2025—that each preceded major price surges of over 150%.
Dogecoin’s 150% Breakout Pattern Is BackAbbé writes via X: “DOGE is currently in a bullish descending channel, similar to Q4 2023 and Q3 2024. In both cases, the breakout resulted in a 150%+ pump.” The chart illustrates how Dogecoin formed a downward-sloping channel in Q4 2023 before breaking out around late December of that year and rallying by more than 150% in subsequent weeks.
A similar formation emerged in Q3 2024, with Dogecoin again trading within tight descending trendlines before pushing through the channel’s upper boundary. That breakout yielded another sizeable price move, once again exceeding 150%.
Now, Abbé points out that Dogecoin appears to be mirroring those past setups, trading within what he identifies as a “bullish descending channel.” Price action on the 3-day timeframe shows Dogecoin bouncing between parallel trendlines that slope downward from roughly $0.36 at their highest to around $0.24 at their lowest.
If this pattern follows the same trajectory as in 2023 and 2024, Abbé suggests a significant upside could be in store once the token decisively breaks the channel’s resistance. The DOGE price is currently at the lower end of the channel, which could signal a buying opportunity. However, a break to the downside could invalidate the bullish setup from the past.
Beyond short-term market sentiment—still subdued for meme-based cryptocurrencies—Abbé points to Dogecoin’s decade-long presence in the crypto landscape as evidence of the coin’s staying power. He noted: “I know sentiment for memes is down a lot, but $DOGE has been in this space for a decade and will continue to be here. A $1 DOGE is a realistic price target for this cycle.”
Although no guarantee exists that history will replicate itself precisely, Abbé’s chart underlines a consistent technical structure that has preceded Dogecoin’s sharp moves in the past.
Buy Signal Confirmed?Meanwhile, another analyst, Ali Martinez (@ali_charts), offered a shorter-term view. Sharing his thoughts via X, Martinez said the TD Sequential indicator on the 4-hour chart is showing a buy signal, which often hints at an impending shift in momentum.
“Dogecoin could be gearing up for a rebound, as the TD Sequential indicator flashes a buy signal on the 4-hour chart!” Martinez writes via X. The TD Sequential is widely followed by technical traders for its ability to time local price tops and bottoms.
However, one user questioned Martinez’s commentary, pointing out that the analyst had mentioned a “death cross” between the MVRV Ratio and its 200-day moving average just yesterday. Martinez countered by emphasizing the natural ebb and flow of all markets: “Tell me an asset that goes in one direction in a straight line.”
At press time, DOGE traded at $0.25456.
Why this matters
This altcoin story adds another data point to the current market tape and is useful when read alongside nearby source coverage.
Original source
Read on NewsBTCRelated market context

Bitcoin (BTC) Price Prediction: Hidden Weekly RSI Divergence Warns of Pullback as BTC Tests $80K
Bitcoin price was trading around $80,500 on Bitstamp in the latest technical reading, up 3.11% on the session. While the price rem...

Sui (SUI) Price Prediction: ETF Inflows and 100MA Support Strengthen $1.15 Outlook
Recent SUI price action has focused attention on the $0.73-$0.76 area, where several short- and medium-term moving averages are pr...
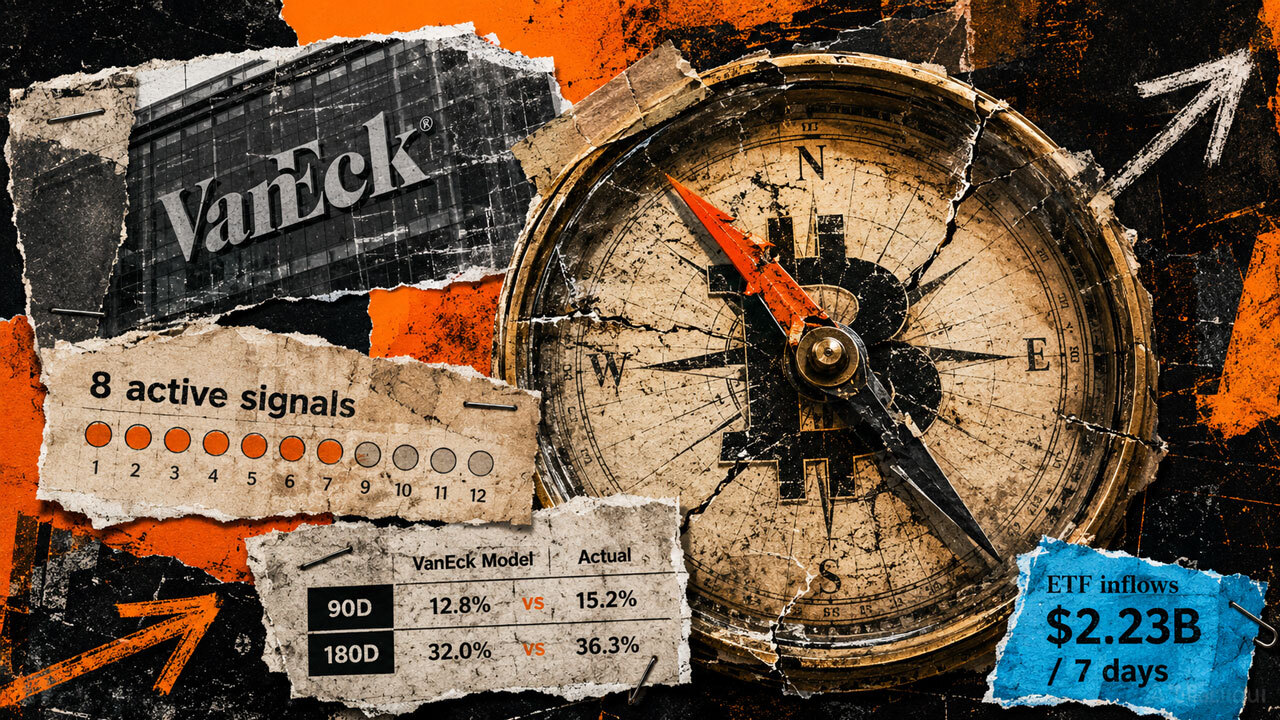
Bitcoin’s bottom signal is flashing, but six months of data shows a trap waiting for early buyers
Bitcoin’s late-August recovery has unfolded in stages. Days prior to the Aug. 19 pump, VanEck’s capitulation dashboard showed broa...

Bitcoin Price Prediction: Can BTC Reclaim $80K This Week?
Bitcoin price prediction has the leading digital asset trading at $79,400, down -0.4% on the day, as the market digests a violent...

XRP News: Ripple Latest SEC Filing Shakes Holders
XRP is trading at $1.44, but the number that matters is buried in regulatory filing news. A new SEC document has holders re-readin...

Ethereum (ETH) Price Prediction: ETH Holds $2,400 Breakout as Bulls Target $2,600 and $2,823
Ethereum price has quietly worked its way back into an important part of the chart after a strong recovery from recent lows. The p...