Dogecoin Targets $1.60 As Historic Fractal Repeats: Analyst
A fresh chart shared on X by the pseudonymous technician Charting Guy is stoking renewed bullish chatter around Dogecoin, suggesting that the meme-coin best known for its social-media cult could be setting up for a run t...
Archive context
Older archive item. Useful for background and entity history, but not a fresh market-moving signal.
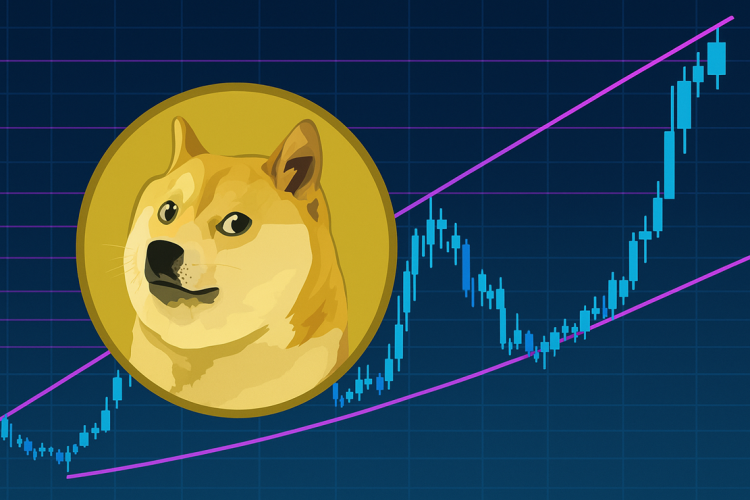
A fresh chart shared on X by the pseudonymous technician Charting Guy is stoking renewed bullish chatter around Dogecoin, suggesting that the meme-coin best known for its social-media cult could be setting up for a run toward the upper boundary of a multiyear rising wedge near $1.60.
Will Dogecoin Skyrocket Above $1?The analyst’s daily chart (BINANCE: DOGEUSDT) frames nearly two years of price action inside a broad, magenta-coloured ascending wedge whose support has risen from roughly $0.06 in late-2023 to $0.17 today, and whose resistance projects to $1.10–1.60 over the coming months. At press time DOGE is changing hands at $0.2219, up 8.7 percent on the day, having just pierced the wedge’s internal trend line that capped every rally until mid-July 2025.
A cluster of Fibonacci retracement and extension levels anchored to the chart’s swing low at $0.0491 and swing high at $0.7605 defines the roadmap that traders are watching. The token has already reclaimed the 0.382 retracement at $0.1399 and the psychological $0.20 handle, and is now hovering above the 0.50 zone at $0.1933 – ahead of the more technically significant golden ratio at 0.618 ($0.2671). Above that, fib-derived hurdles stack at 0.702 ($0.3362), 0.786 ($0.4232), and 0.888 ($0.5596), with the full retrace level at $0.7605 and the 1.272 extension demarcated at $1.6017 – precisely where the wedge’s ceiling converges in the analyst’s projection.
What lends the setup its narrative force is a cyan overlay on the same chart – a fractal copy of DOGE’s eruptive late 2024 leg – that has been transplanted onto the current structure. In that earlier episode the coin rocketed 439 percent once price tagged rising-wedge support, sliced through the internal down-sloping resistance, retested it as support and accelerated straight to the upper boundary.
The overlay implies that a similar sequence has begun to unfold: DOGE revisited wedge support in late June, broke the internal trend line in mid-July, and retested it successfully this week– if the fractal continues to rhyme – could embark on a vertiginous sprint that terminates where the 1.272 extension meets the wedge roof just north of $1.60.
The monthly view reinforces the bullish undertone. Charting Guy points out that the Relative Strength Index (RSI) is on the verge of a bullish cross of its own moving average in the 50–55 band. The last time that crossover occurred, in early 2024, price embarked on the aforementioned 439 percent advance. While momentum has cooled since that high, the oscillator never broke down into oversold territory, suggesting, in classical technical parlance, that DOGE has been basing rather than topping.
Sceptics will note that the same wedge has twice rejected advances below $0.50, and that the memecoin still lives below every major high-time-frame supply shelf until $0.76. Yet the chart’s geometry leaves room for a rapid repricing should buyers clear the $0.27–0.34 resistance cluster: the “empty air” between the 0.702 and 0.888 fibs coincides with the steepest part of the wedge.
For now, traders have a textbook trigger to watch – the internal magenta down-trend that DOGE has just tested from above. A decisive weekly close above that line, coupled with rising volume, would formally confirm the breakout scenario. Failure to hold $0.20 would invalidate the fractal and shift focus back to wedge support, currently near $0.17.
Whether history will repeat with the precision that the fractal projects remains to be seen, but the structural logic on the chart is clear: so long as Dogecoin respects its four-year rising base, the path of least resistance continues to tilt higher – and the upper edge of that structure terminates at $1.60. The coming weeks should reveal whether the meme-asset can turn that technical aspiration into market reality.
At press time, DOGE traded at $0.22.
Why this matters
This altcoin story adds another data point to the current market tape and is useful when read alongside nearby source coverage.
Original source
Read on NewsBTCRelated market context

Bitcoin (BTC) Price Prediction: $80K Breakout Sets Sights on New Upside Targets as Bullish Wave 3 Emerges
The move has placed the Bitcoin price back at a key technical level, while renewed spot demand and stronger exchange-traded fund (...

XRP Soars, But What’s Really Happening? Can Ripple Blast Past $10 This Year?
XRP is trading at $1.41, down 2% over the past 24 hours in a mild pullback after one of the sharpest weekly moves in the top-10. T...

Ripple News: Network Activity Jumps, Will XRP Follow?
XRP trades at $1.43, pulling back after a move in a striking on-chain trajectory of the month. Ripple, the XRP parent company, is...

Ethereum (ETH) Price Prediction: ETH Holds $2,400 Breakout as Bulls Target $2,600 and $2,823
Ethereum price has quietly worked its way back into an important part of the chart after a strong recovery from recent lows. The p...

Ethereum Price Hits $2,500 Resistance Wall as Fear and Greed Reaches Extreme Levels
Ethereum trades at $2,450 as it continues probing the $2,500 price ceiling it’s failed to convincingly break for the third straigh...

Bitcoin traders hedged $60k and loaded up above $78k leaving the low $70k exposed
Bitcoin's end-of-September options expiry holds 130,670 BTC of open interest, compared with 79,003 BTC for August, a headline gap...