Dogecoin To $3.94 This Cycle? This Chart Says It’s No Meme
In a monthly chart shared on July 8, crypto analyst Kevin (@Kev_Capital_TA) outlined a long-term bullish thesis for Dogecoin (DOGE), identifying a clear historical pattern that may signal the next major leg in its price...
Archive context
Older archive item. Useful for background and entity history, but not a fresh market-moving signal.

In a monthly chart shared on July 8, crypto analyst Kevin (@Kev_Capital_TA) outlined a long-term bullish thesis for Dogecoin (DOGE), identifying a clear historical pattern that may signal the next major leg in its price trajectory. The focal point of the chart is the 1.618 Fibonacci extension—used as a key projection level—which Kevin implies is Dogecoin’s next major upside target. Based on the chart, this level corresponds to $3.94.
History Says Dogecoin Will Hit $3.94Dogecoin’s price action has followed a remarkably consistent macro-pattern across three major market phases. In each, DOGE formed a clear descending wedge, followed by an impulsive breakout and parabolic rally. These structures are annotated in yellow on the chart and preceded both the 2017 and 2021 bull runs. The most recent wedge breakout completed in November last year, with a retest of the breakout currently taking place.
Kevin marks two historical Fibonacci extension levels that were reached following previous consolidations. Both peaked near the 1.618 Fibonacci extension of their respective bases—a common target for extended bullish moves in technical analysis. For the current structure, this places DOGE’s long-term Fibonacci target near $3.94, which would represent a roughly 2,218% move from the current price around $0.17.
Indicators further support the notion of a long-term base having formed. The RSI (Relative Strength Index) on the monthly chart has just reclaimed the neutral 50 zone, currently sitting at 50.39, a signal often interpreted as the transition from bearish to bullish control. In prior cycle, the monthly RSI always topped above 90. Notably, the monthly RSI is also in an uptrend since mid-2022, respecting the yellow trendline drawn by the analyst.
A significant confluence comes from the Stochastic RSI, which has just completed a bottoming crossover in the oversold region. The last time this occurred, in early 2020, Dogecoin followed with a parabolic surge. This same dynamic now appears to be setting up again, echoing the previous cycle.
Also noteworthy is the chart’s structural emphasis on 0.382 Fibonacci retracement support, currently plotted at $0.13778, from which Dogecoin appears to be bouncing. This aligns with the green supertrend support, suggesting a critical local floor has been found.
While the purple zones on the chart above $0.50 are not formal price targets, Kevin clarified in a response to a community member that they are key resistance zones—intermediary checkpoints before DOGE can make a full move toward its final Fibonacci extension. These zones span from approximately $1.00 to $1.20 as well as from $2.30 to $2.50, and eventually up toward the $3.94 range.
Kevin emphasized that “as well as Dogecoin has done this cycle especially compared to other altcoins, it still has not even come close to what it is capable of. That will change in the right environment.” He further noted that Dogecoin has already seen a 10x move from its bear market low to the local highs, but believes “there’s still work to do” when the cycle of quantitative tightening by the US Federal Reserve ends.
The chart and commentary triggered a strong community reaction. Users like @MonetaryRegimee declared “We always hit the 1.618,” to which Kevin replied, “Typically yes,” reinforcing his confidence in the fractal repetition. Others described the current price action as “the calm before the storm.”
Whether Dogecoin ultimately fulfills its fractal-driven destiny toward $3.94 remains to be seen. But the historical technical symmetry laid out by Kevin’s chart offers a compelling case that DOGE’s long-term rally may be far from over.
At press time, DOGE traded at $0.174.
Why this matters
This altcoin story adds another data point to the current market tape and is useful when read alongside nearby source coverage.
Original source
Read on NewsBTCRelated market context

Bitcoin Price Prediction: Peter Brandt Might Dump BTC for Gold
Bitcoin is facing a test, and its price prediction is not helping. So far in 2026, BTC has fallen about 28%, while gold is down ju...

Strategy faces $8.3 billion Bitcoin Q2 loss as Saylor sells over $200M in BTC
Strategy’s largest Bitcoin sale in years has put new pressure on the corporate treasury model that made Michael Saylor one of the...
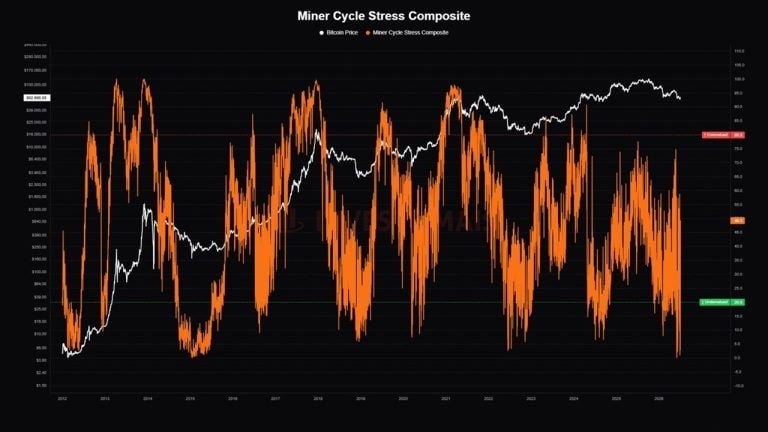
Bitcoin Miner Stress Hits ‘Historically Rare’ Level as 20% of Miners Operate at a Loss
Bitcoin’s Miner Cycle Stress Composite has fallen to a new 2026 low and entered its “undervalued” range, a synchronized decline pr...

Bitcoin miner bottom signal now depends on who survives weak mining profits
A Bitcoin miner-stress signal circulating on X has fallen into a zone analysts associate with severe miner pressure, putting a fam...

Vitalik Buterin Says Ethereum’s Next Major Upgrade Will Take Three to Four Years and Rival the Merge
Ethereum co-founder Vitalik Buterin says the network’s next major overhaul, an initiative researchers are calling “Lean Ethereum,”...

Bitcoin Suisse Advances Middle East Expansion, Receives Financial Services Permission in Abu Dhabi
Zug, Switzerland, July 7th, 2026, Chainwire Premium virtual assets pioneer BTCS (Middle East) Ltd. is now fully authorized by the...