Dogecoin Under $0.20 ‘Is Free,’ Says Analyst—Predicts 2,000% Upside
Dogecoin is revisiting a technical juncture it has not seen since the months preceding its 2020–21 parabolic rally, according to a comparative chart published by the pseudonymous analyst Kaleo to his 705,000 followers on...
Archive context
Older archive item. Useful for background and entity history, but not a fresh market-moving signal.

Dogecoin is revisiting a technical juncture it has not seen since the months preceding its 2020–21 parabolic rally, according to a comparative chart published by the pseudonymous analyst Kaleo to his 705,000 followers on X. In the annotated TradingView graphic, weekly candles for DOGE-USD trace two multi-year falling wedge structures—one stretching from the January 2018 high to early 2021, and an almost mirror-image pattern extending from the May 2021 peak until today.
History Repeating For Dogecoin?The first wedge resolved in late 2020 with a decisive breakout above a descending trend-line that had capped every rally for more than thirty-six months. Kaleo marks that moment with a yellow label reading “We are here” at roughly $0.003, immediately before the price detonated to the cycle top near $0.75 in May 2021.
The current structure shows the same downward-sloping resistance—now anchored by successive lower highs from $0.16 in late 2022 to $0.11 in late 2023—finally giving way. Since the, DOGE has recorded higher highs in April at $0.22 and in December 2024 at $0.48.
Friday’s close printed at $0.1604, still below the psychological $0.20 threshold but fractionally above the dotted secondary resistance that has defined the wedge’s upper boundary since mid-2022. Kaleo’s overlay projects the 2020 breakout trajectory forward in time, mapping a near-vertical thrust from the present $0.16 area to roughly $0.55, a brief consolidation, and a continuation leg that tops close to $3.50.
While this upper target hasn’t ever been printed in DOGE’s history, the analyst’s replica path underscores how little overhead structure exists once price escapes the wedge.
A key role in the chart are playing the two vertical dashed lines labeled “BTC Halving”: 12 May 2020 and 21 April 2024. In Kaleo’s read, Dogecoin’s macro reversals are synchronized with Bitcoin’s quadrennial supply shock, implying that the breakout could be a post-halving echo of the 2020 move.
Price construction within the wedge also mirrors the earlier cycle: successive lower highs and higher lows compress volatility until an impulsive weekly bar pierces resistance. The horizontal line intersecting the new breakout—will be the first major test of post-wedge momentum. Below, the lower dashed boundary intersects in the region between $0.10 and $0.09; a weekly close beneath that floor would invalidate the fractal.
Kaleo distills the setup into a single line: “Dogecoin under 20 cents is free.” On the chart’s scale, the red quote-box at $0.1604 sits a hair’s breadth under the $0.20 psychological band, reinforcing the idea that the risk-to-reward profile remains asymmetric so long as price stays below that number.
Whether history rhymes as precisely as the analyst’s fractal suggests will hinge on broader market liquidity and Bitcoin’s dominance, but from a purely structural perspective the meme-coin has already checked the same boxes it did four years ago. And the US Federal Reserve money printer hasn’t even started roaring again.
At press time, DOGE traded at $0.161.
Why this matters
This altcoin story adds another data point to the current market tape and is useful when read alongside nearby source coverage.
Original source
Read on NewsBTCRelated market context

Bitcoin (BTC) Price Prediction: Hidden Weekly RSI Divergence Warns of Pullback as BTC Tests $80K
Bitcoin price was trading around $80,500 on Bitstamp in the latest technical reading, up 3.11% on the session. While the price rem...

Ethereum (ETH) Price Prediction: ETH Holds $2,400 Breakout as Bulls Target $2,600 and $2,823
Ethereum price has quietly worked its way back into an important part of the chart after a strong recovery from recent lows. The p...

XRP News: Ripple Latest SEC Filing Shakes Holders
XRP is trading at $1.44, but the number that matters is buried in regulatory filing news. A new SEC document has holders re-readin...
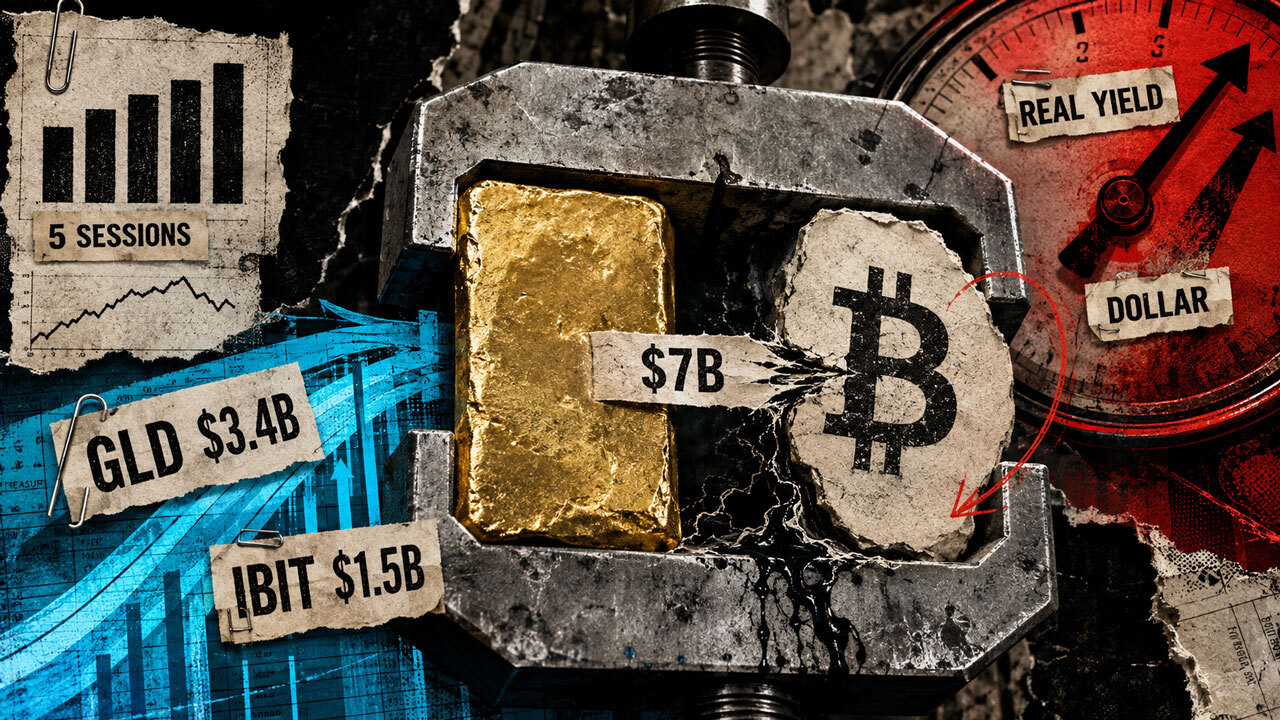
Investors just moved $7 billion into Bitcoin and gold in five days to escape an accelerating dollar crisis
Gold and Bitcoin exchange-traded funds (ETFs) drew roughly $7 billion over five US trading sessions, a record combined haul that p...

Morgan Stanley leads Solana ETF $9 million inflows as SOL jumps rises above $100
US Solana exchange-traded funds (ETFs) attracted about $9.1 million in net inflows on Aug. 26, led by Morgan Stanley’s MSOL. SoSoV...
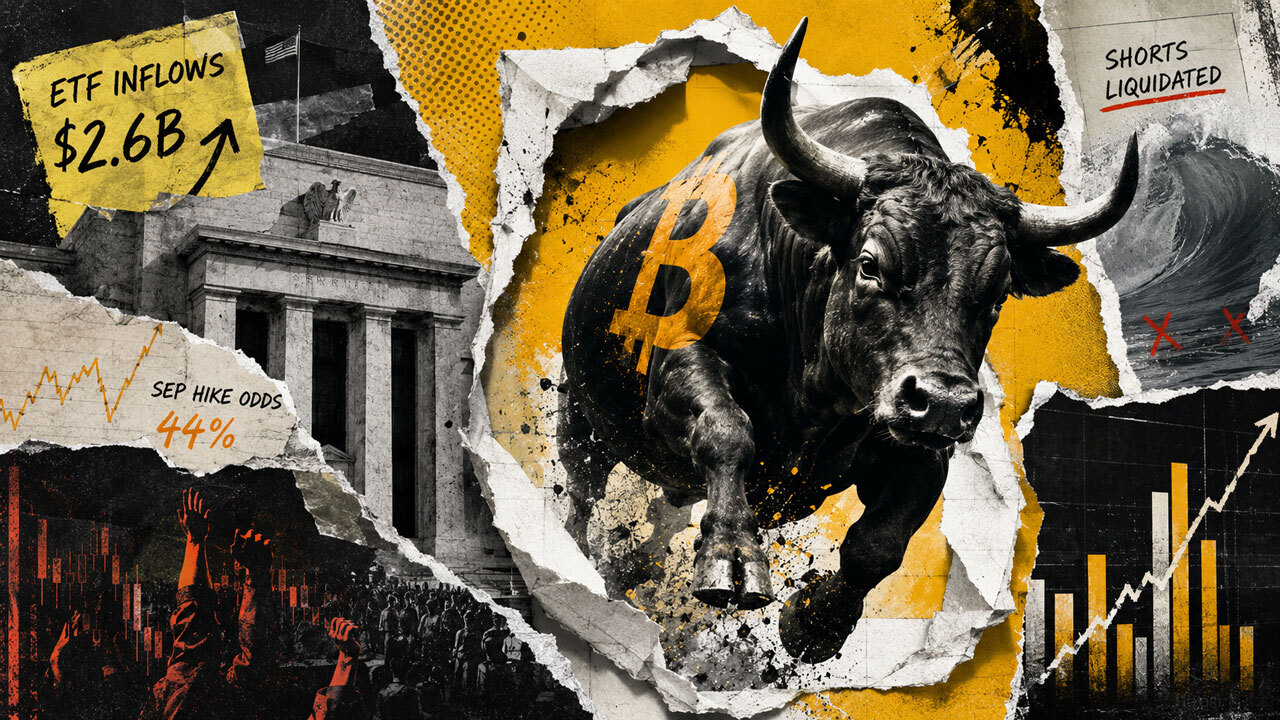
Behind Bitcoin’s sudden resilience is a $2 billion cash surge that wiped out speculative leverage
July's PCE inflation reading held at 3.7% headline and 3.3% core on Aug. 26, both still above the Fed's target. Futures markets re...