Dogecoin’s Potential: Can DOGE Price Kick Off a New Climb?
Dogecoin is stuck below the $0.1285 resistance zone against the US Dollar. DOGE is consolidating and might eye a fresh increase toward $0.1285 or even $0.1320. DOGE price is struggling to clear the $0.1285 resistance zon...

Dogecoin is stuck below the $0.1285 resistance zone against the US Dollar. DOGE is consolidating and might eye a fresh increase toward $0.1285 or even $0.1320.
- DOGE price is struggling to clear the $0.1285 resistance zone.
- The price is trading near the $0.1240 level and the 100-hourly simple moving average.
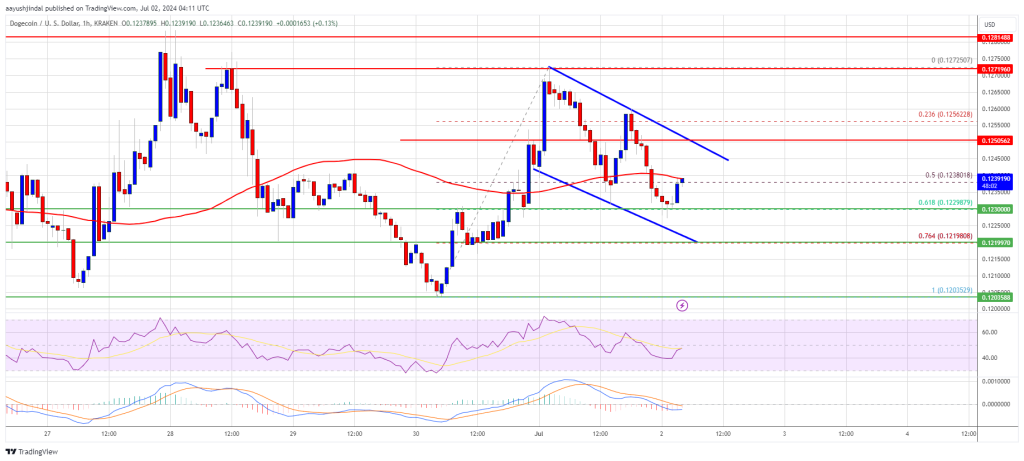
- There is a short-term bullish flag pattern forming with resistance at $0.1250 on the hourly chart of the DOGE/USD pair (data source from Kraken).
- The price must settle above $0.1250 and $0.1285 to gain bullish momentum.
After a decent recovery wave, Dogecoin price remained below the $0.1285 resistance zone. DOGE formed a high near $0.1272 and recently started a downside correction like Bitcoin and Ethereum.
There was a move below the $0.1250 support level. The price dipped below the 50% Fib retracement level of the upward move from the $0.1203 swing low to the $0.1272 high. However, the bulls are now active near the $0.1220 zone.
Dogecoin is now trading near the $0.1250 level and the 100-hourly simple moving average. It is also above the 61.8% Fib retracement level of the upward move from the $0.1203 swing low to the $0.1272 high.
If there is a fresh increase, the price might face resistance near the $0.1250 level. There is also a short-term bullish flag pattern forming with resistance at $0.1250 on the hourly chart of the DOGE/USD pair. The next major resistance is near the $0.1285 level.
A close above the $0.1285 resistance might send the price toward the $0.1320 resistance. Any more gains might send the price toward the $0.1350 level. The next major stop for the bulls might be $0.150.
More Downsides In DOGE?If DOGE’s price fails to gain pace above the $0.1250 level, it could continue to move down. Initial support on the downside is near the $0.1230 level.
The next major support is near the $0.1220 level. If there is a downside break below the $0.1220 support, the price could decline further. In the stated case, the price might decline toward the $0.1185 level.
Technical Indicators
Hourly MACD – The MACD for DOGE/USD is now losing momentum in the bearish zone.
Hourly RSI (Relative Strength Index) – The RSI for DOGE/USD is now below the 50 level.
Major Support Levels – $0.1230, $0.1220 and $0.1185.
Major Resistance Levels – $0.1250, $0.1285, and $0.1320.
Original source
Read on NewsBTCRelated market context

Standard Chartered Says Bitcoin Bottomed Near $59,000 As Crypto Winter Ends
TL;DR Standard Chartered’s Geoffrey Kendrick reportedly says Bitcoin’s $59,000 area marked the cycle bottom. The note cites SpaceX...

US forces shoot down Iranian attack drones near Strait of Hormuz, Bitcoin drops below $73K
Geopolitical tensions near vital oil routes can destabilize financial markets, highlighting the interconnectedness of global secur...

Bitcoin price challenges $64,000 weekend wall – needing a breakout or risk a deeper correction
Bitcoin reclaimed $64,000 on June 12 and touched an intraday high of $64,301 in the same session that spot ETF flows finally flipp...

Bitcoin Mining Cost Model Points To $47,000 Floor, But Analysts Urge Caution
TL;DR Crypto Rover says Bitcoin has never bottomed below electrical production cost, currently estimated at $47,000. Mining-cost m...

Uranium Holds Above $85 as Mining ETF Rebounds From June Sell-Off
The latest charts display that the market is divided into stable physical prices and uranium shares trying to regain momentum afte...

Tether USDT Briefly Overtakes Ethereum in Market Cap: A $187B Wake-Up Call
For a few hours, earlier this week, Tether USDT stablecoin held a higher market cap than Ethereum, the first time that has happene...