Dogecoin’s Rally Ride: DOGE Hang On Tight or Prepare to Bark!
Dogecoin corrected gains and tested the $0.1620 zone against the US Dollar. DOGE is now forming a base and might start a fresh increase above $0.1680. DOGE price declined and tested the key support at $0.1620. The price...

Dogecoin corrected gains and tested the $0.1620 zone against the US Dollar. DOGE is now forming a base and might start a fresh increase above $0.1680.
- DOGE price declined and tested the key support at $0.1620.
- The price is trading below the $0.1650 level and the 100-hourly simple moving average.
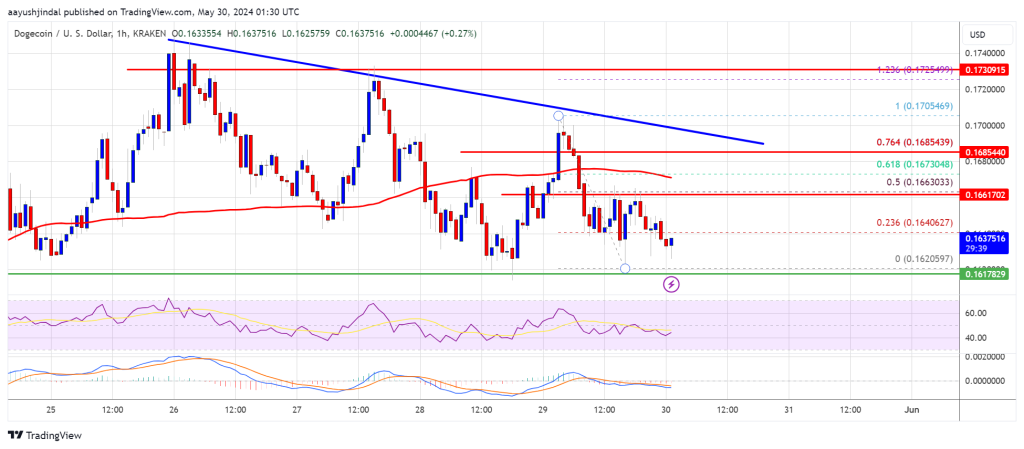
- There is a key bearish trend line forming with resistance at $0.1685 on the hourly chart of the DOGE/USD pair (data source from Kraken).
- The price must settle above $0.170 to move into a positive zone and start a fresh surge.
After a steady increase, Dogecoin price faced resistance near the $0.1750 zone. The recent swing high was formed at $0.1705 before DOGE started a downside correction like Bitcoin and Ethereum. There was a drop below the $0.1650 support zone.
A low was formed at $0.1620 and DOGE is now consolidating for the next move. Dogecoin is now trading below the $0.1650 level and the 100-hourly simple moving average. On the upside, the price is facing resistance near the $0.1664 level. It is near the 50% Fib retracement level of the downward move from the $0.1705 swing high to the $0.1620 low.
The next major resistance is near the $0.1685 level or the 76.4% Fib retracement level of the downward move from the $0.1705 swing high to the $0.1620 low. There is also a key bearish trend line forming with resistance at $0.1685 on the hourly chart of the DOGE/USD pair.
A close above the $0.1685 resistance might send the price toward the $0.1725 resistance. Any more gains might send the price toward the $0.1750 level. The next major stop for the bulls might be $0.1800.
More Losses In DOGE?If DOGE’s price fails to gain pace above the $0.1685 level, it could start another decline. Initial support on the downside is near the $0.1620 level.
The next major support is near the $0.1550 level. If there is a downside break below the $0.1550 support, the price could decline further. In the stated case, the price might decline toward the $0.1520 level.
Technical Indicators
Hourly MACD – The MACD for DOGE/USD is now losing momentum in the bearish zone.
Hourly RSI (Relative Strength Index) – The RSI for DOGE/USD is now below the 50 level.
Major Support Levels – $0.1620, $0.1550 and $0.1520.
Major Resistance Levels – $0.1660, $0.1685, and $0.1720.
Original source
Read on NewsBTCRelated market context

Uranium Holds Above $85 as Mining ETF Rebounds From June Sell-Off
The latest charts display that the market is divided into stable physical prices and uranium shares trying to regain momentum afte...

Elon Musk’s trillionaire status puts his net worth above crypto’s entire market cap outside Bitcoin
Elon Musk has become the first person in modern history to amass a personal net worth exceeding $1 trillion, crossing the historic...

Bitcoin price challenges $64,000 weekend wall – needing a breakout or risk a deeper correction
Bitcoin reclaimed $64,000 on June 12 and touched an intraday high of $64,301 in the same session that spot ETF flows finally flipp...

Bitcoin rises above $64,000 after Pakistan prime minister says Iran peace deal is near
Bitcoin traded above $64,000 on Saturday, supported by its strongest ETF inflows in a month and growing optimism around geopolitic...

Standard Chartered Says Bitcoin Bottomed Near $59,000 As Crypto Winter Ends
TL;DR Standard Chartered’s Geoffrey Kendrick reportedly says Bitcoin’s $59,000 area marked the cycle bottom. The note cites SpaceX...

US forces shoot down Iranian attack drones near Strait of Hormuz, Bitcoin drops below $73K
Geopolitical tensions near vital oil routes can destabilize financial markets, highlighting the interconnectedness of global secur...