History rhymes? XRP price gained 400% the last time whale flows flipped
Key takeaways:XRP price has risen 55% since April and is now flashing bullish continuation signals.Whale flows have flipped positive for the first time since November 2024, historically signaling trend reversals.A fallin...
Archive context
Older archive item. Useful for background and entity history, but not a fresh market-moving signal.

Key takeaways:
XRP price has risen 55% since April and is now flashing bullish continuation signals.
Whale flows have flipped positive for the first time since November 2024, historically signaling trend reversals.
A falling wedge breakout projects 40% gains ahead, but $2.80 may act as interim resistance.
XRP (XRP) has bounced by more than 55% since forming a local bottom at around $1.61 in April. It now signals a further price surge owing to bullish technical patterns and onchain data.
XRP/USD daily price chart. Source: TradingViewXRP’s whale flows mirror 2024 price boomXRP whale wallets (addresses holding large amounts of XRP) have been aggressively reducing their holdings since November 2024, according to data resource CryptoQuant.
XRP whale flow 30-day moving average vs. price. Source: CryptoQuantThe trend pushed net flows deep into negative territory, preceding the sharp correction in XRP’s price from above $3.55 to under $2.00.
As of mid-May 2025, however, the trend has reversed.
Whale outflows have been slowing down, turning the 90-day moving average of net flows positive. In the past, most instances where whale flows turned positive after a prolonged negative trend has marked major bottoms or trend reversals.
A notable example is XRP’s rally from around $0.43 in July 2024 to $3.55 in January 2025, or around 400% gains, which began as whale outflows slowed and eventually flipped to net inflows.
XRP price technical breakout targets $3.45XRP price technicals show it breaking out of a multimonth falling wedge pattern on the 3-day chart, typically viewed as a bullish reversal setup.
The wedge, formed between December 2024 and early May 2025, had been compressing price action while volume declined, a classic sign of accumulation.
XRP/USD three-day price chart. Source: TradingViewThe breakout occurred in early May near the $2.25 level, just above the 50-period exponential moving average (EMA), which now acts as key support. Based on the wedge’s height, the breakout projects a price target near $3.45, around 40% above current levels.
Related: Can XRP price reach $4 in May? Analysts are watching these key levels
XRP’s relative strength index (RSI) also supports the bullish case, bouncing back above 57 and showing renewed buying momentum.
The move may not be a straight shot to the target, however. Analyst Mags highlights a key resistance near $2.80 that could temporarily cap XRP’s upside.
Source: X/MagsIn the near term, XRP may consolidate above its 50-day EMA, particularly as whale inflows often signal the start of an accumulation phase before a stronger price breakout.
“The pace of outflows is slowing, and the bars are curling upward,” wrote Kripto Mavsimi, an analyst associated with CryptoQuant, adding:
“It’s not full reversal yet — but it’s the first real sign of stabilization in months.”Such a base-building period would be a healthy development if consistent with how previous whale-driven rallies have unfolded.
This article does not contain investment advice or recommendations. Every investment and trading move involves risk, and readers should conduct their own research when making a decision.
Why this matters
This altcoin story adds another data point to the current market tape and is useful when read alongside nearby source coverage.
Original source
Read on CointelegraphRelated market context

Morgan Stanley leads Solana ETF $9 million inflows as SOL jumps rises above $100
US Solana exchange-traded funds (ETFs) attracted about $9.1 million in net inflows on Aug. 26, led by Morgan Stanley’s MSOL. SoSoV...

Ethereum (ETH) Price Prediction: ETH Holds $2,400 Breakout as Bulls Target $2,600 and $2,823
Ethereum price has quietly worked its way back into an important part of the chart after a strong recovery from recent lows. The p...
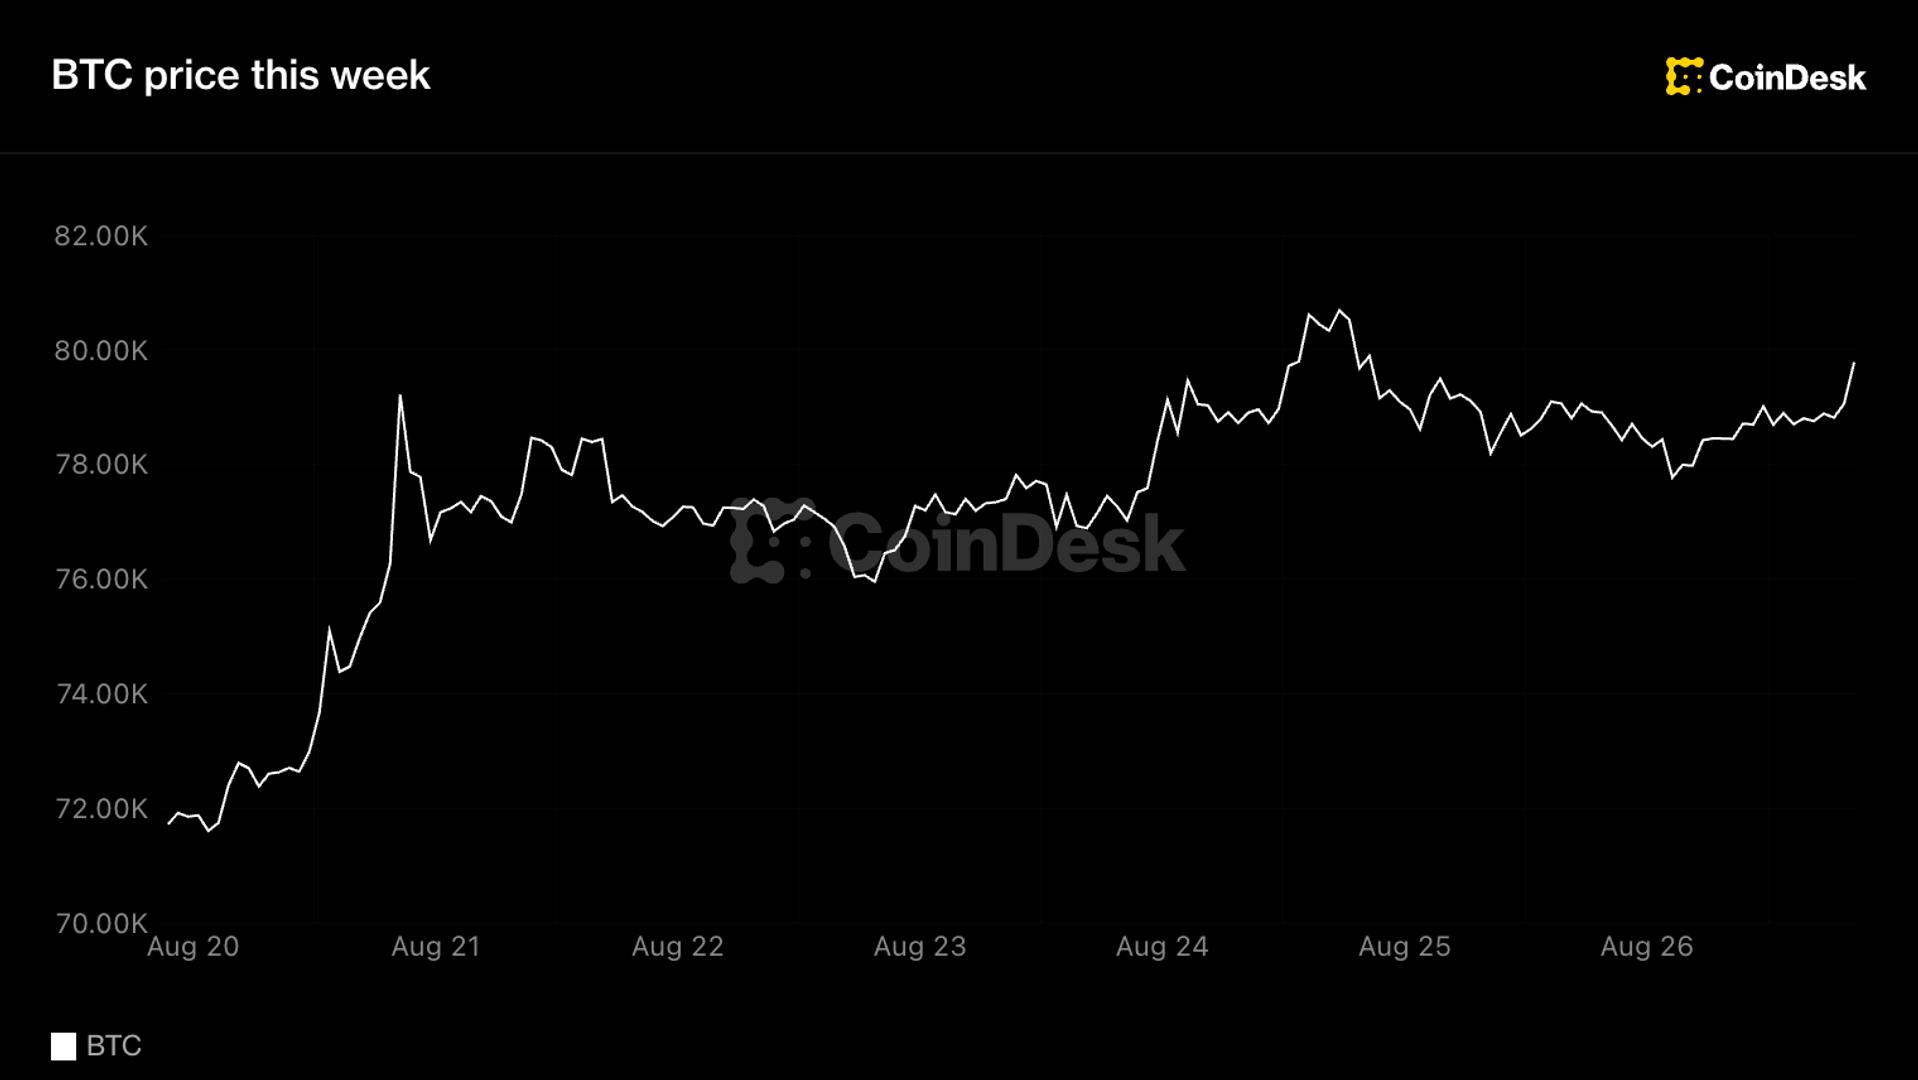
Bitcoin steadies above $79,000 as ETF inflows hit longest streak since April
BTC held its ground Thursday as spot bitcoin ETFs logged an eighth straight day of net inflows, while altcoins drifted lower acros...

Bitcoin (BTC) Price Prediction: Hidden Weekly RSI Divergence Warns of Pullback as BTC Tests $80K
Bitcoin price was trading around $80,500 on Bitstamp in the latest technical reading, up 3.11% on the session. While the price rem...

XRP Price Caught Between $231M Whale Selling and ETF Inflows
XRP price is trying to reconcile two conflicting signals coming from the asset. One points to distribution. The other points to ac...

Bitcoin surges above $80,000 amid record ETF inflows and a Treasury-fueled macro shift
Bitcoin's surge highlights the growing influence of macroeconomic shifts and institutional investments, potentially reshaping fina...