How Low Can Dogecoin Go Before Rallying Again? Expert Forecast
Dogecoin (DOGE) has recently experienced a staggering rally. Over the span of eight days, DOGE surged nearly 200%, reaching a local peak at $0.4385 on Tuesday. This explosive growth propelled the daily Relative Strength...
Archive context
Older archive item. Useful for background and entity history, but not a fresh market-moving signal.

Dogecoin (DOGE) has recently experienced a staggering rally. Over the span of eight days, DOGE surged nearly 200%, reaching a local peak at $0.4385 on Tuesday. This explosive growth propelled the daily Relative Strength Index (RSI) to almost 93, signaling strongly overbought conditions.
Since then, the Dogecoin price corrected by 19%, trading at $0.37 as of press time. However, according to crypto analyst Kevin (@Kev_Capital_TA), who has gained significant attention on X for his Dogecoin price analyses, the correction phase may not be over yet. In a series of updates, Kevin addresses how low Dogecoin can go before resuming its upward trajectory.
How Low Can Dogecoin Go?“My first price target and a level we will want to hold for Dogecoin is the $0.30-0.26 range, which is the golden pocket retrace levels,” Kevin stated. “That’s a 30-40% correction from the local top, which in a bull market is a perfect size correction.”
Kevin further explained the significance of RSI levels in predicting market movements. “A healthy 1-3 week correction/consolidation to cool off indicators would be the most beneficial thing that can happen to Dogecoin. Happened multiple times on the way up in 2020-2021,” he noted. “My opinion still remains this occurs soon based off the technical data I am looking at.”
Drawing parallels to the previous bull market, he added: “Back in the 2020-2021 bull market for Dogecoin, it hit a 90+ on daily RSI three times, each time marking a local top or consolidation period before the next leg up. We just hit 90+ on the daily RSI for the first time, signaling that we potentially have 1-2 more legs up remaining in this bull market before we find the macro top. PS: The second and third legs were both bigger than the first leg.”
On the lower time frames, the Dogecoin price action formed a symmetrical triangle, a chart pattern often associated with periods of consolidation that precede significant price movements. Kevin observed: “Tracking this weird Dogecoin symmetrical triangle. Honestly a 50/50 which way this breaks. I still favor the correction due to daily RSI being 90+.”
The symmetrical triangle can serve as either a continuation or a reversal pattern, depending on market conditions. For the Dogecoin price, the breakdown from the triangle aligns with Kevin’s expectation of a correction due to overbought RSI levels.
To estimate the potential magnitude of the price drop following the breakdown from the symmetrical triangle, traders measure the height of the triangle’s base—the widest part of the formation. This measurement is then projected downward from the point of breakdown, providing a target for the price movement.
Applying this method to Dogecoin suggests a correction towards the $0.28 price level, which aligns closely with Kevin’s analysis targeting the $0.30-$0.26 range. “Looks like the correction I have been calling for the last couple of days is beginning on Dogecoin,” Kevin confirmed after observing the market movement. “Can’t go straight up, folks. Dips are healthy and reset the indicators so we can go higher. Hopefully nobody gets mad at me anymore for delivering the truth.”
As of press time, Dogecoin is trading at approximately $0.37, having retraced about 19% from its local top. The price appears to have found temporary support at $0.35, but with the daily RSI only resetting to 80—still in overbought territory—a continuation of the correction cannot be ruled out.
“A healthy 1-3 week correction/consolidation to cool off indicators would be the most beneficial thing that can happen to Dogecoin,” Kevin reiterated. “Happened multiple times on the way up in 2020-2021. My opinion still remains this occurs soon based off the technical data I am looking at.”
Why this matters
This altcoin story adds another data point to the current market tape and is useful when read alongside nearby source coverage.
Original source
Read on NewsBTCRelated market context

Dogecoin (DOGE) Price Prediction: DOGE Holds Near $0.084 as $0.09 Breakout Could Open $0.115
Dogecoin is back in the spotlight as price slips towards the $0.084 area, putting an important support zone under pressure. The la...

XRP Price Targets $2 as One Key Metric Flashes Bullish Signal
XRP price is sitting in a corrective pocket after one of its stronger months of the year. That $2 target sounds ambitious given th...

Bitcoin (BTC) Price Today: Whale Buying Strengthens Bullish Case as BTC Consolidates Near $79K
At the same time, technical indicators show that the recent rally has become stretched, leaving Bitcoin price caught between a con...

Bitcoin Faces a Three-Way Macro Test Near $78,000
Bitcoin traded at $78,500 as the Japanese yen breached 160 per dollar in Tokyo trading, while a U.S. strike on Iran’s Larak Island...
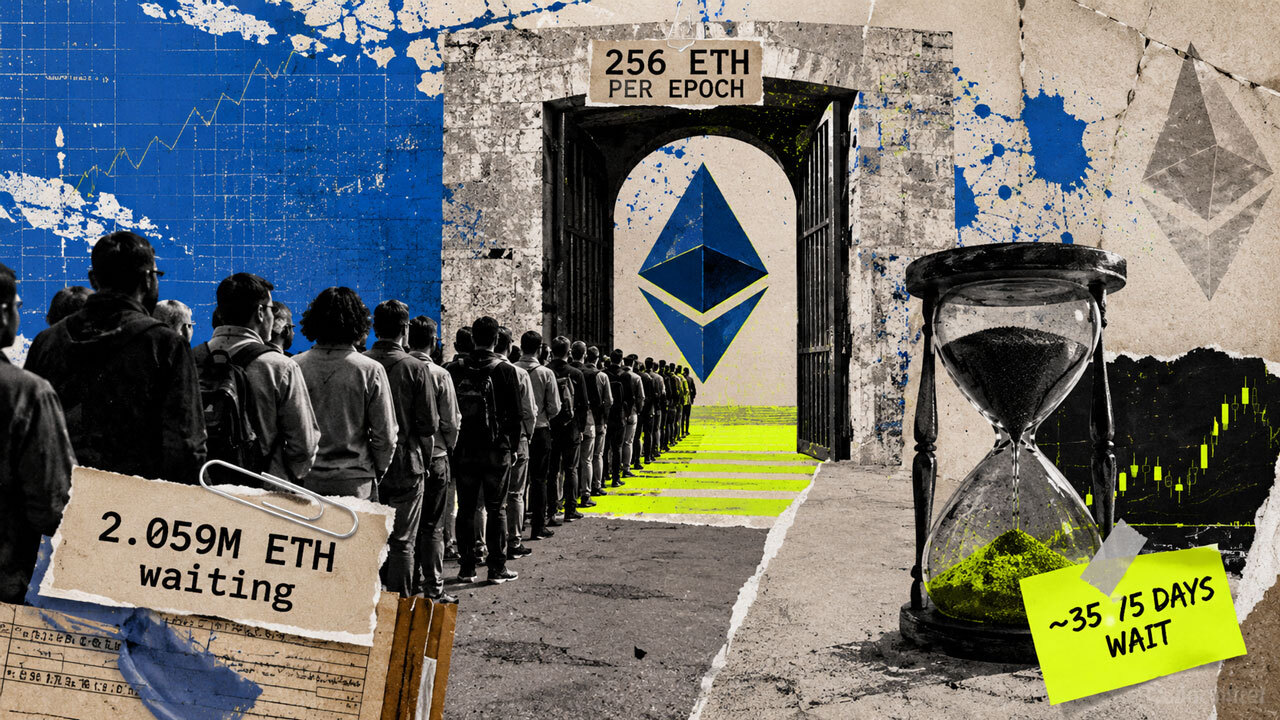
A 36-day staking bottleneck is costing Ethereum depositors over $350,000 in lost rewards daily
More than 2 million ETH is waiting to enter Ethereum staking as the amount already staked reaches a record high. Ethereum’s valida...

Bitcoin miner IREN still gets 82% of revenue from BTC after clearing room for Microsoft AI cloud
IREN is still mostly a Bitcoin miner by revenue, even as it retires mining hardware to make room for AI infrastructure and grow IR...