Is The XRP Bottom Finally In? Here’s What Experts Say
The XRP price fell as low as $2.0238 on Monday, potentially forming a local bottom. Since then, the XRP price is up almost 6%, however, the possibility of a deeper retracement remains. Two prominent chartists—CasiTrades...
Archive context
Older archive item. Useful for background and entity history, but not a fresh market-moving signal.

The XRP price fell as low as $2.0238 on Monday, potentially forming a local bottom. Since then, the XRP price is up almost 6%, however, the possibility of a deeper retracement remains. Two prominent chartists—CasiTrades (@CasiTrades) and Charting Guy (@ChartingGuy)—have shared their perspectives on whether the token has found its local bottom or if further downside might still be on the table.
Is The XRP Price Bottom In?According to CasiTrades’ newly published chart, XRP appears to have tested the 0.786 Fibonacci retracement at $2.05 and is now showing bullish divergences across multiple timeframes—from the 15-minute all the way to the 4-hour chart. CasiTrades notes that these signals are a positive indicator both for short-term bounces and a potential macro recovery.
“Was that the bottom for XRP? After reaching the .786 retrace at $2.05, #XRP is printing bullish divergences from the 15min all the way up to the 4hr chart. That’s the kind of signal we want to see for both short-term bottom and macro! The bounce is holding so far! CasiTrades notes.
The analyst also points to key resistance at $2.25, suggesting that a convincing break above this level with strong momentum would likely negate the need for another retest of support. “If we break above $2.25 with strong momentum, that would invalidate the need for another support retest—a very bullish sign, CasiTrades writes, adding “$2.00–2.01 remains a support if the $2.05 doesn’t hold.”
Moreover, she highlights a Fib Time Zone 3 that could span the entire month of April, forecasting a “bullish window” for XRP. According to the chart, once price meets its target, a larger impulse to the upside may follow, with potential resistance lining up at $2.70 and $3.80+.
Meanwhile, Charting Guy addressed that market chatter has surfaced about a possible head and shoulders pattern on the XRP chart, with a projected breakdown target near $1.15. While acknowledging this bearish formation as a possibility, Charting Guy believes it is unlikely to play out, describing the pattern as “irregular and ugly.”
He maintains that XRP’s overall trend is still biased to the upside, characterized by higher highs and higher lows.“ A lot of people are posting this possible head and shoulders that targets $1.15. I personally don’t think it plays out, but it’s a possibility. If it does happen, it’s just a golden pocket backtest and the chart remains bullish overall,” he says.
Charting Guy draws attention to the $1.70–$1.90 zone that has repeatedly caught wicks in previous pullbacks, with daily closes managing to reclaim $2 or above. He believes that a final corrective dip to fill the March 11 wick lows—potentially down to around $1.90—could mark the end of the current retracement.
Additional support levels are located at the weekly Ichimoku base line at $1.94, the Weekly Supertrend at $1.73 and at the Weekly EMA Ribbon between $1.46 – $1.93.
At press time, XRP traded at $2.14.
Why this matters
This altcoin story adds another data point to the current market tape and is useful when read alongside nearby source coverage.
Original source
Read on NewsBTCRelated market context

Bitcoin (BTC) Price Prediction: Hidden Weekly RSI Divergence Warns of Pullback as BTC Tests $80K
Bitcoin price was trading around $80,500 on Bitstamp in the latest technical reading, up 3.11% on the session. While the price rem...

Morgan Stanley leads Solana ETF $9 million inflows as SOL jumps rises above $100
US Solana exchange-traded funds (ETFs) attracted about $9.1 million in net inflows on Aug. 26, led by Morgan Stanley’s MSOL. SoSoV...
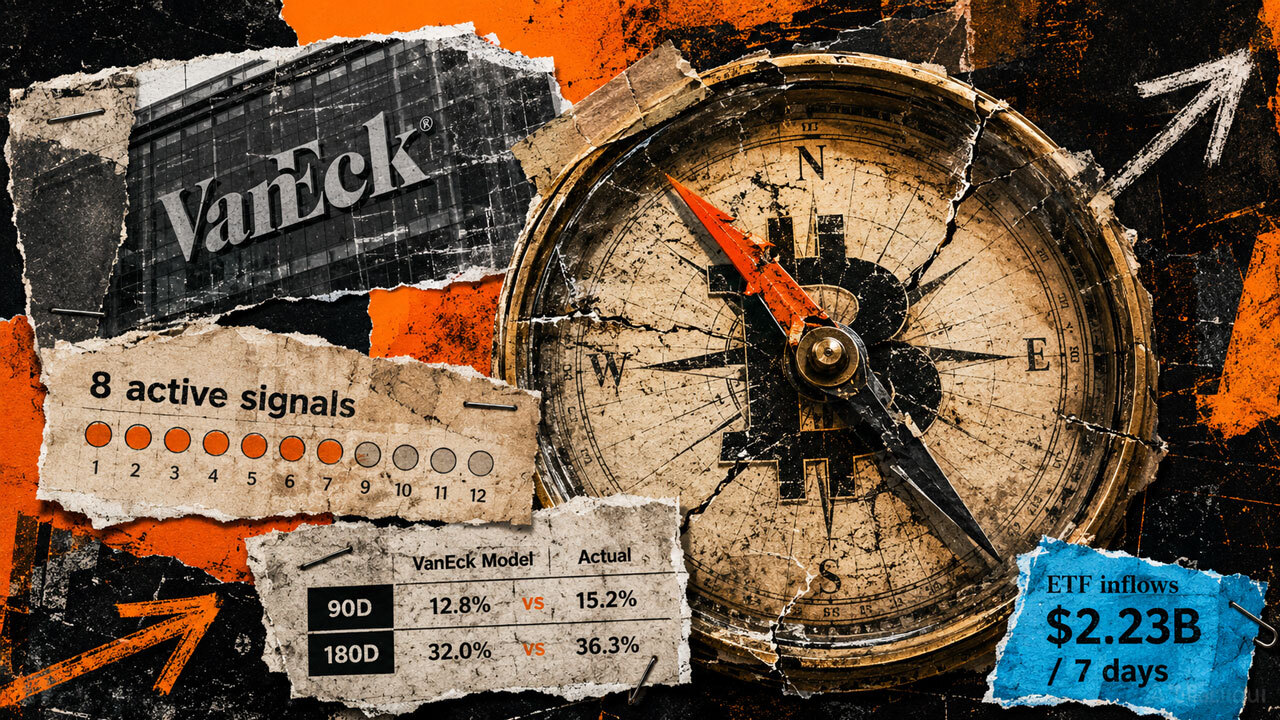
Bitcoin’s bottom signal is flashing, but six months of data shows a trap waiting for early buyers
Bitcoin’s late-August recovery has unfolded in stages. Days prior to the Aug. 19 pump, VanEck’s capitulation dashboard showed broa...

Ethereum (ETH) Price Prediction: ETH Holds $2,400 Breakout as Bulls Target $2,600 and $2,823
Ethereum price has quietly worked its way back into an important part of the chart after a strong recovery from recent lows. The p...
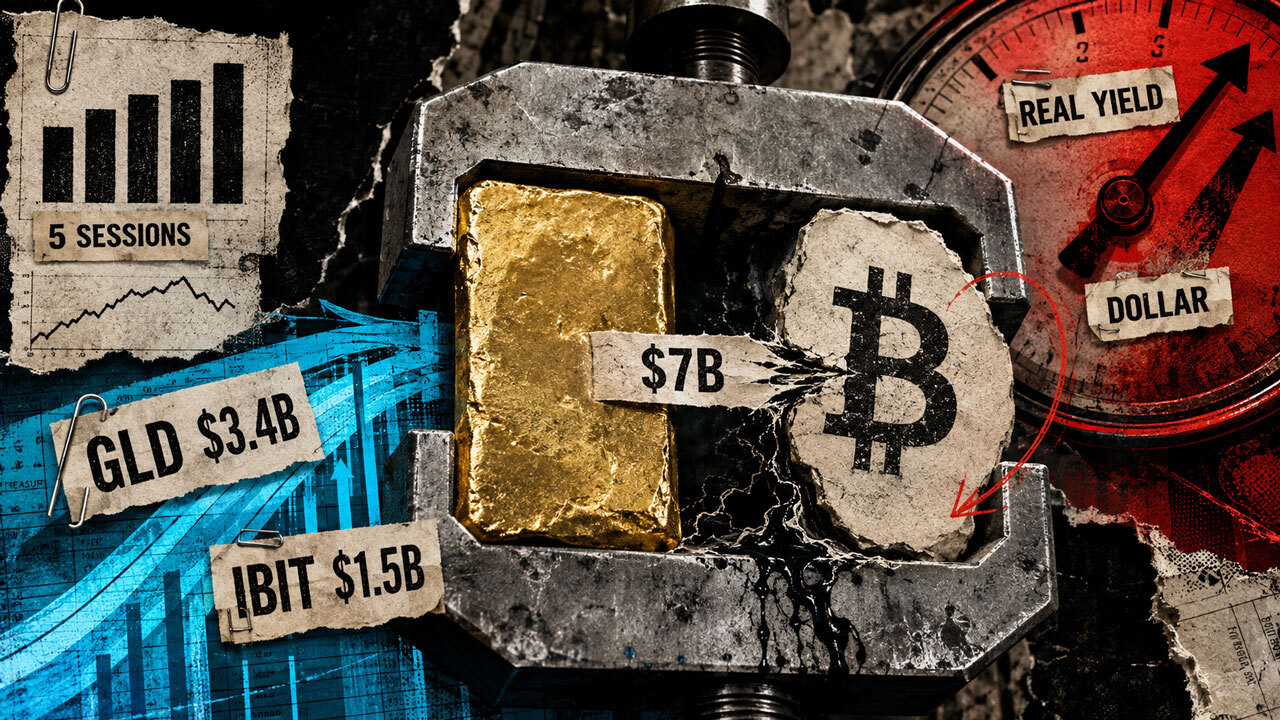
Investors just moved $7 billion into Bitcoin and gold in five days to escape an accelerating dollar crisis
Gold and Bitcoin exchange-traded funds (ETFs) drew roughly $7 billion over five US trading sessions, a record combined haul that p...

Bitcoin Retakes $80,000 as ETF Flows Fuel Biggest Weekly Rally in Three Years
Bitcoin climbs above $80,000 in its biggest weekly rally in three years as Bitcoin and gold funds draw $7 billion and regulators m...