Is The XRP Bottom In? Traders Pin The Floor Between $1.20 And $1.00
XRP is down 58% from its all-time high, and two popular chart-focused accounts on X are framing the drawdown as a potential accumulation window rather than a trend break. How Low Will XRP Price Go? Crypto Patel (@CryptoP...
Archive context
Older archive item. Useful for background and entity history, but not a fresh market-moving signal.

XRP is down 58% from its all-time high, and two popular chart-focused accounts on X are framing the drawdown as a potential accumulation window rather than a trend break.
How Low Will XRP Price Go?Crypto Patel (@CryptoPatel) told followers on Feb. 4 that XRP/USD has “entered our first accumulation zone at $1.50–$1.30.” In his post, he urged staggered entries rather than trying to time a single bottom. “Start buying slowly at these levels, no rush, just steady accumulation,” he wrote, positioning the move as capital-preservation after what he described as an earlier call highlighting a “bottom accumulation zone.”
On the risk side, Patel tied his next decision point to the $1.30 level, suggesting a deeper set of bids if that floor breaks. “If XRP breaks below $1.30, place your entry bids between $0.90–$0.70,” he wrote. “But here’s the thing — if price hits that zone, it could be the best long-term accumulation opportunity for maximum profits.”
He added that his “long-term target remains $10,” arguing that entry discipline matters more than headline targets: “Buying at $3 or $2? Not ideal in my view. If the target is $10, why not aim for entries at $1.50–$1 during hard dips for much bigger returns?”
Patel also leaned on his prior public call as evidence of a repeatable framework. He said he shared an XRP setup at $0.50 in the last bear market and that XRP later rallied to $3.66, which he characterized as “over 600% profit.”
XRP Bottom In March?A separate post from Charting Guy framed the selloff less as a new regime and more as a familiar cycle structure. “XRP repeating 2021, bottom in march roughly around $1.20 imo,” he wrote, adding: “maybe wick to $1 to scare the hoes. The bear market is almost over.” When asked directly by another user—“Bear market ends in march?”—Charting Guy replied: “yep.”
In Charting Guy’s weekly XRP/USD chart, the roadmap is framed around a rising multi-year trendline and a Fibonacci ladder drawn across the move, with several of those Fib levels clustering right where he expects a March low.
On the retracement side, the chart labels the key downside bands at roughly 0.618 ($0.915) and 0.702 ($1.2149), with additional levels below at 0.5 ($0.615) and 0.382 ($0.413). Charting Guy’s “bottom in March roughly around $1.20” lines up almost directly with the 0.702 Fib (~$1.215), while his “maybe wick to $1” comment points toward a deeper flush into the space between $1.00 and the 0.618 Fib (~$0.915).
What makes that zone more than just a horizontal level on his layout is the trendline confluence. The green, rising trendline he’s drawn from the 2020–2022 base is shown catching price into early March (his vertical marker sits around Mon 02 Mar ’26), with the trendline effectively rising into the same $1.00–$1.20 neighborhood.
In other words, his implied “March bottom” isn’t just a date call, it’s a confluence call: trendline support rising into the 0.702 retracement area, with room for a volatility wick closer to the 0.618 if the market tries to force capitulation.
Above spot, the chart also shows the upside Fib extensions he’s using as reference points: 0.786 ($1.612), 0.888 ($2.274), and the prior swing reference around 1.0 ($3.317), with higher extensions marked at 1.236 ($7.349), 1.272 ($8.297), 1.414 ($13.389), and 1.618 ($26.630).
At press time, XRP traded at $1.3888.
Why this matters
XRP is a tracked market entity in the DigitalMoneyBox archive, making this useful context for readers monitoring repeated mentions and follow-up coverage.
Original source
Read on NewsBTCRelated market context

Meta AI Predicts This Huge Catalyst Could Lead to $40 XRP
Mark Zuckerberg’s Meta AI predicts an insanely wild bullish price target for XRP by January 1, 2027. The AI bot believes $25–$40 i...
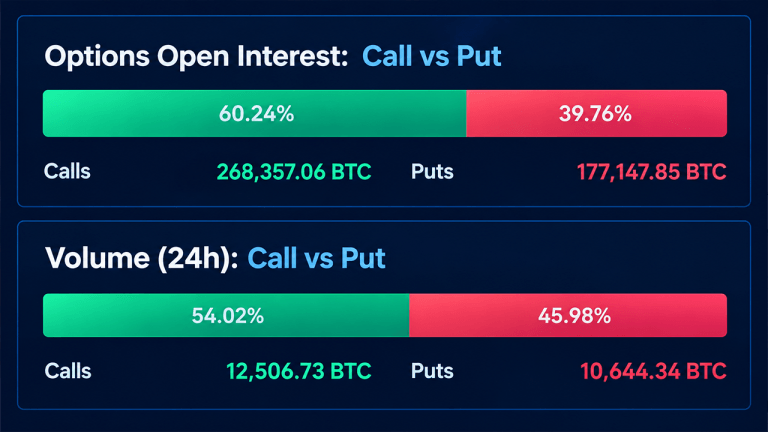
Bitcoin Traders Stack $4.5 Billion in Calls as $95K Bets Take Shape
Bitcoin’s options market is sending a curious message. With bitcoin trading above $82,000, calls account for 60.24% of outstanding...
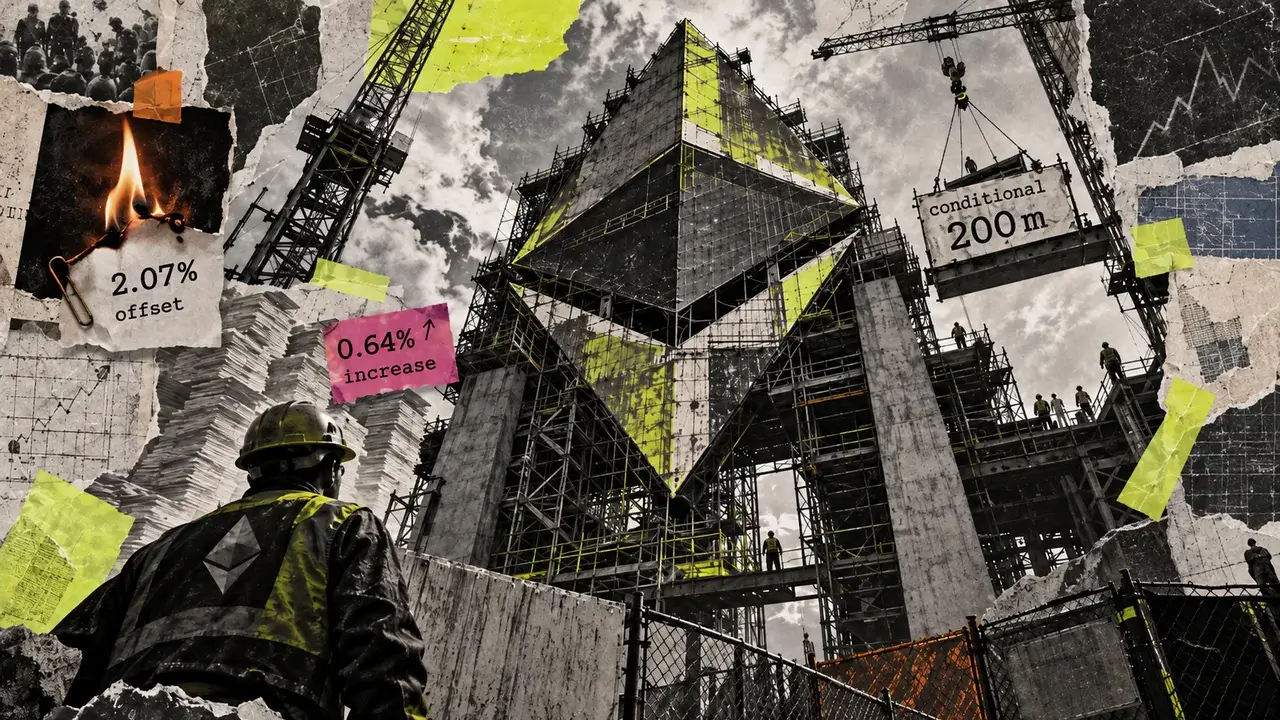
ETH fee burns cover just 2% of new coins printed in 2026
Ethereum's transaction fees have burned enough ETH to offset just 2.07% of the new coins issued in 2026, according to an Oct. 9 su...

Ethereum Price Prediction: Is Tom Lee’s $25K ETH Target Too Ambitious?
Tom Lee’s $10,000 Ethereum price prediction implies a 1000% move from ETH’s current price at around $2,500. BitMine’s accumulation...

XRP Price, Outflows, and Bitcoin Shorts Send Mixed Signals
Binance and Upbit XRP reserves fell by a combined 104.7 million tokens, with data putting XRP whales at 77% of centralized-exchang...

Bitcoin Price Prediction: Can BTC USD Hold $82K Ahead of Next Week’s CPI Drop?
Bitcoin price prediction notes a brief recovery on Saturday, October 10, but the market remains poised for a weekly loss as rising...