Moon soon? XRP's strongest spot premium aligns with 70% rally setup
Key takeaways:XRP’s strongest spot premium phase suggests real buying demand, not just speculative futures trading. The number of XRP addresses holding ≥10,000 tokens has steadily climbed, even during recent price pullba...
Archive context
Older archive item. Useful for background and entity history, but not a fresh market-moving signal.

Key takeaways:
XRP’s strongest spot premium phase suggests real buying demand, not just speculative futures trading.
The number of XRP addresses holding ≥10,000 tokens has steadily climbed, even during recent price pullbacks.
A falling wedge pattern points to a possible breakout toward $3 to $3.78, with up to 70% upside if confirmed.
XRP (XRP) is experiencing its strongest sustained phase of spot premium in history, a period where the spot market has been consistently trading at stronger levels compared to perpetual futures.
XRP’s 350% rally is backed by real demandSince 2020, most major XRP price peaks happened when the perpetual futures market was leading, noted market analyst Dom in his May 2 post on X.
XRP’s futures prices being higher than spot signaled excessive speculation and led to sharp price drops.
XRP/USD daily price ft. spot vs premium rates. Source: TradingView/DomAs of 2025, a spot premium suggests that demand from actual XRP buyers is driving the rally, pointing to a more stable price rise compared to past runs powered by leveraged bets.
Further reinforcing the case for real demand, Glassnode data shows a consistent rise in the number of XRP addresses holding at least 10,000 XRP (the green wave in the chart below) since late November 2024.
XRP’s price has rallied by approximately 350% since then.
XRP number of addresses with a balance of over 10,000 tokens vs. price. Source: GlassnodeXRP’s whale count has risen even during its 35% price pullback between January and April. It suggests that larger holders—often viewed as more patient or strategic investors—are steadily accumulating positions in anticipation of further gains.
Optimism has been fueled by improving odds of spot XRP ETF approval in the US. The US Securities and Exchange Commission’s (SEC) decision to drop its lawsuit against Ripple has further boosted the market’s upside sentiment.
Source: Eric BalchunasRelated: SEC punts decisions on XRP, DOGE ETFs
Falling wedge hints at 70% XRP price rallyXRP has been consolidating within a falling wedge pattern on the weekly chart — a structure defined by downward-sloping, converging trendlines. In technical analysis, this pattern is generally viewed as a bullish reversal signal.
A confirmed breakout requires a clear move above the wedge’s upper resistance near $2.52.
XRP/USD weekly price chart. Source: TradingViewIf XRP breaks this level, the pattern’s measured move — calculated from the wedge’s maximum height — suggests a potential rally toward $3.78 by June. This would represent an estimated 70% upside from the current prices.
Conversely, if XRP fails to break above the $2.52 resistance, the price could pull back toward the wedge’s lower trendline. The pattern’s apex near $1.81 may act as the final potential breakout point.
A breakout from the $1.81 level would still keep the pattern’s structure intact, with a potential upside target around $3 by June or July — roughly 35% above current levels.
This article does not contain investment advice or recommendations. Every investment and trading move involves risk, and readers should conduct their own research when making a decision.
Why this matters
This altcoin story adds another data point to the current market tape and is useful when read alongside nearby source coverage.
Original source
Read on CointelegraphRelated market context

Behind Bitcoin’s sudden resilience is a $2 billion cash surge that wiped out speculative leverage
July's PCE inflation reading held at 3.7% headline and 3.3% core on Aug. 26, both still above the Fed's target. Futures markets re...

JPMorgan’s IBIT Bitcoin ETF bet just missed its escape hatch to avoid 6% deduction
The iShares Bitcoin Trust ETF (IBIT) closed at $44.46 on Aug. 26, about 30.2% below the $63.69 price needed to trigger an early ex...

Ethereum (ETH) Price Prediction: ETH Holds $2,400 Breakout as Bulls Target $2,600 and $2,823
Ethereum price has quietly worked its way back into an important part of the chart after a strong recovery from recent lows. The p...
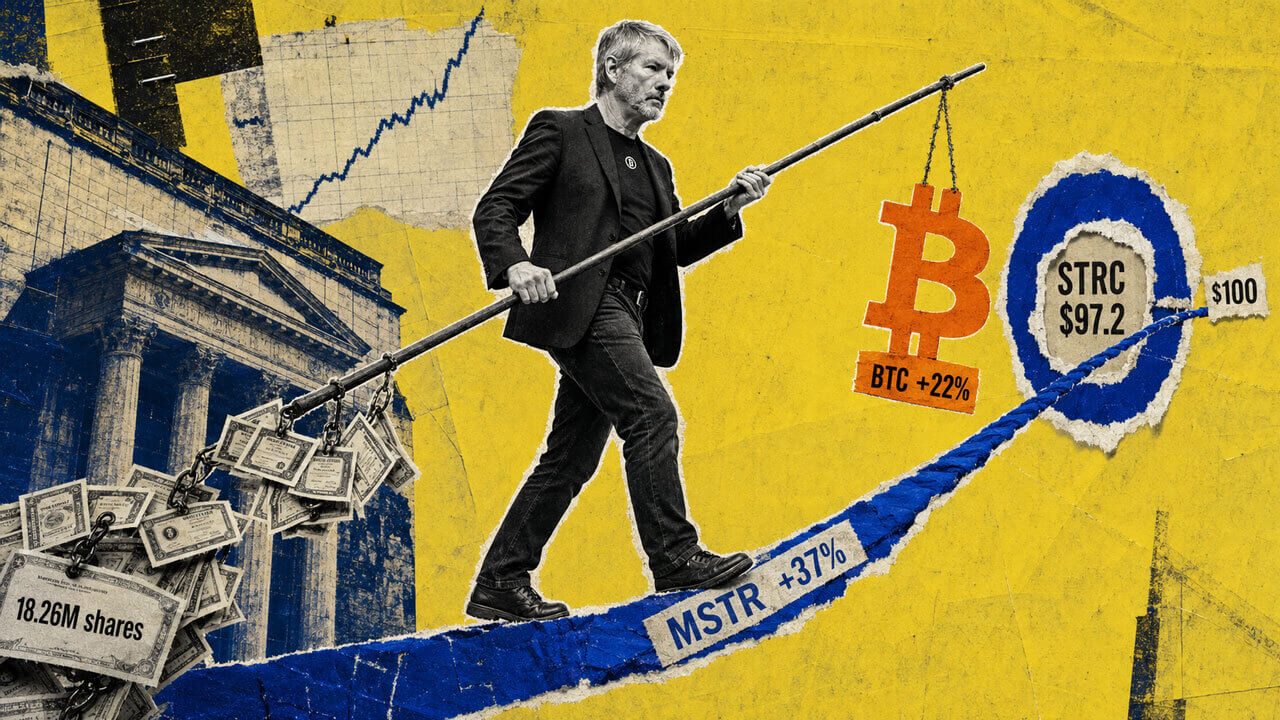
Strategy’s MSTR quietly outperforms Bitcoin’s $80,000 rally as STRC closes in on $100
Bitcoin's sharp two-week recovery, which briefly pushed its value above $80,000, has brought Michael Saylor's Strategy BTC treasur...

Bitcoin Price Prediction: Can BTC Get Back Over $80,000?
Today’s Bitcoin price prediction has BTC trading at $79,500, up around +1.1% over the past 24 hours, as the coin’s late-August gri...

Bitcoin (BTC) Price Prediction: Hidden Weekly RSI Divergence Warns of Pullback as BTC Tests $80K
Bitcoin price was trading around $80,500 on Bitstamp in the latest technical reading, up 3.11% on the session. While the price rem...