Shiba Inu (SHIB) Price On The Verge Of Major Breakout, Here’s Why
Since reaching its peak for the year at $0.00004749 over a month ago, on March 5, the price of Shiba Inu (SHIB) has fallen by approximately 40%. Nonetheless, there may be brighter days ahead. Following a meteoric rise of...
Archive context
Older archive item. Useful for background and entity history, but not a fresh market-moving signal.

Since reaching its peak for the year at $0.00004749 over a month ago, on March 5, the price of Shiba Inu (SHIB) has fallen by approximately 40%. Nonetheless, there may be brighter days ahead. Following a meteoric rise of 390% in just eight days from the end of February till the beginning of March, a period of consolidation was inevitable for the SHIB price. However, this phase could be drawing to a close.
Shiba Inu Price About To Surge 65%?On the daily chart, the meme coin is exhibiting a critical chart pattern that suggests a significant price movement may be imminent. The analysis of the daily SHIB/USD chart reveals the emergence of a symmetrical triangle pattern. This classic chart pattern is generally considered a continuation pattern, typically heralding an uptick in volatility. Given that SHIB has been on a notably strong uptrend, the momentum could swing back in favor of the bulls.
Over the past five weeks, the price of SHIB has been making a series of lower highs and higher lows, which is evident from the converging trend lines that are containing the price action. The apex of the triangle is fast approaching, suggesting that a breakout is imminent. This type of consolidation suggests market indecision, and as the pattern reaches its conclusion, we can expect a significant move in either direction.
The current price at the time of the analysis is $0.00002842. Notably, the volume has been declining as the pattern developed, which is typical during the formation of a symmetrical triangle and further validates the pattern.
Exponential Moving Averages (EMAs) also paint a crucial picture. The 20-day EMA is flatlining, suggesting a neutral short-term trend, while the 50, 100, and 200-day EMAs are all trending upward, providing strong support levels. Particularly, the price is currently above the 20-day EMA, which is positioned at approximately $0.00002817, and this level could act as a strong support in the near term.
The Relative Strength Index (RSI) is hovering near the 52.40 level, which is slightly above the midpoint of 50 that separates bullish momentum from bearish momentum. The RSI level indicates a neutral stance in the market momentum but leaves room for an upward push should the market sentiment sway positively.
In terms of deriving price targets from this pattern, technical analysts typically measure the height of the triangle at its widest part and project that distance from the point of breakout.
If SHIB breaks above the triangle, the price could surge, targeting the height of the triangle, which could be in the region of the yearly high at approximately $0.000048, considering the widest part of the pattern. This would translate into a 65% price rally from the current price. Conversely, a downward breakout could send the price to test the $0.00001500 level, which would be the equivalent target on the downside.
It is important to mention that while symmetrical triangles can lead to a substantial breakout, the direction is not certain until a clear breakout occurs with an accompanying increase in volume. Traders and investors need to watch for a daily close outside of the triangle’s boundaries, with increased volume, to confirm the direction of the breakout.
Why this matters
This altcoin story adds another data point to the current market tape and is useful when read alongside nearby source coverage.
Original source
Read on NewsBTCRelated market context

Bitcoin (BTC) Price Prediction: BTC Turns $79K into Support as Risk-On Signal Points to Fresh Rally Toward $100K
The move has also coincided with a shift in Glassnode’s Bitcoin Vector framework. The proprietary model moved into a Risk-On regim...

Ethereum News: Double Three Pattern Hints at Another Rally
Ethereum trades at $2,520, sitting right at the pivot point most analysts have flagged in news outlets for weeks. That’s not a coi...
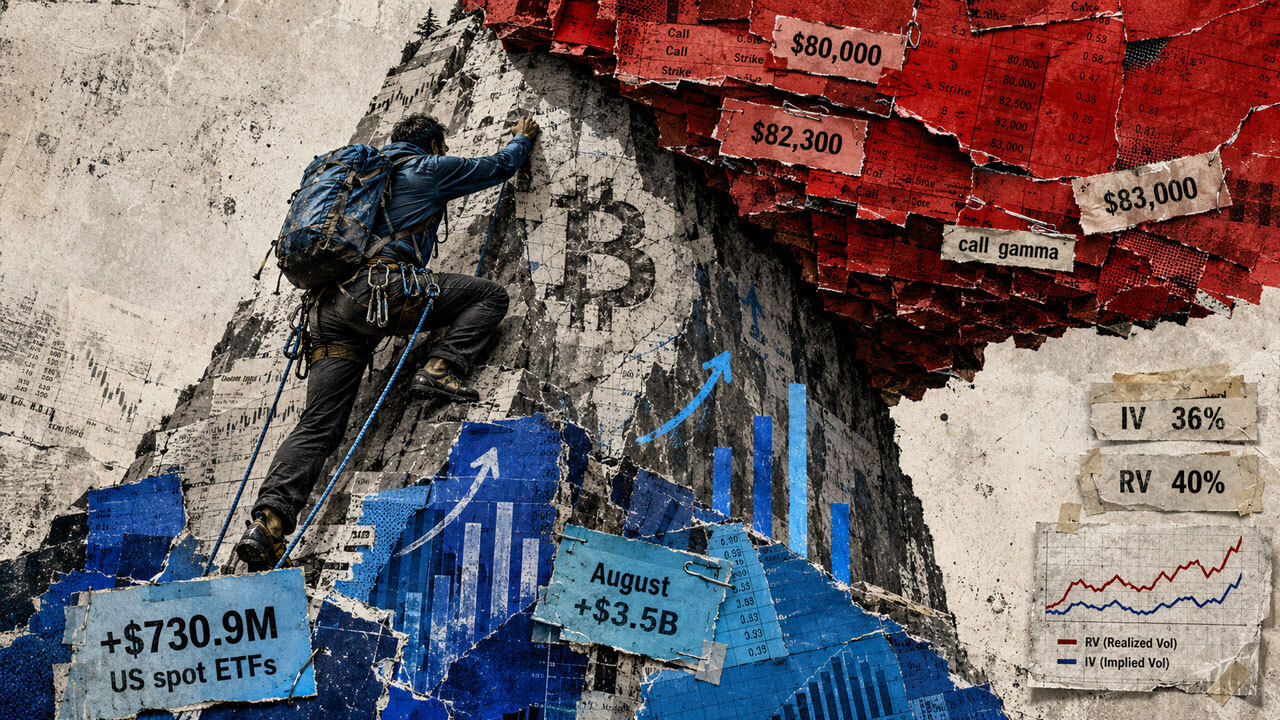
Bitcoin’s rally over $81,000 is finding real buyers, but options traders still aren’t pricing a clean breakout
Bitcoin accelerated above $81,000 on Thursday as easing rate fears and fresh institutional demand lifted the broader crypto market...

Standard Chartered Makes $BTC and $ETH Spot Trading Available to UAE Institutions
Key Takeaways: Standard Chartered has introduced institutional spot trading in the UAE for BitCoin and Ether. The bank says it is...

Bitcoin’s next $80,000 breakout has $47 billion more profitable supply to absorb
Bitcoin trades near $77,381, and Glassnode says 68% of circulating supply now sits in profit at this level, up from 65% when BTC t...

ETH Price Prediction 2027, 2030, 2040: Could it Reach $4,965? Analysing the Potential of Ethereum, Bitcoin, and Apeing’s Upcoming Crypto Presale
On the other hand, Apeing is gaining attention as its planned September 8, 2026 presale approaches. Both these projects sit at ver...