SOL Price Breaks $100 – Why Solana Could Pump Another 10%
Solana is gaining bullish momentum above $100. SOL price is signaling a fresh increase and might rally further toward the $112 level. SOL price started a fresh increase from the $93.20 support against the US Dollar. The...
Archive context
Older archive item. Useful for background and entity history, but not a fresh market-moving signal.

Solana is gaining bullish momentum above $100. SOL price is signaling a fresh increase and might rally further toward the $112 level.
- SOL price started a fresh increase from the $93.20 support against the US Dollar.
- The price is now trading above $98 and the 100 simple moving average (4 hours).
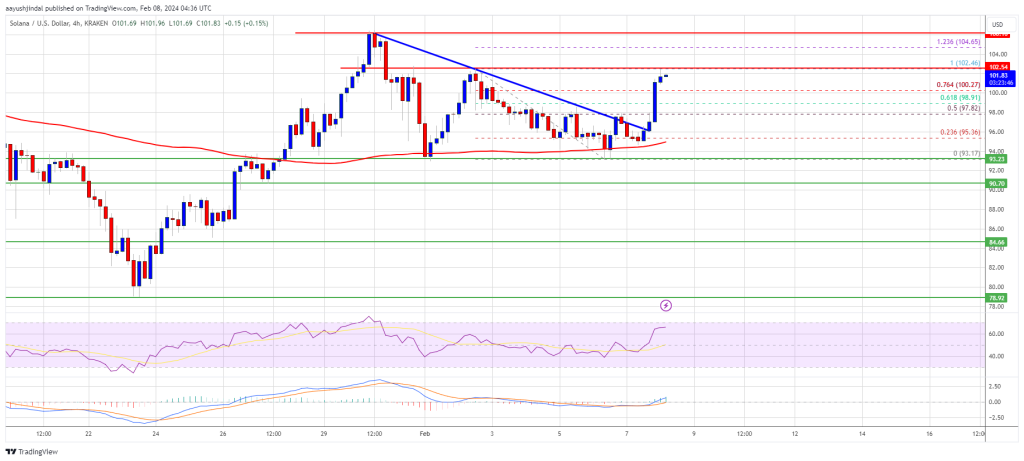
- There was a break above a major bearish trend line with resistance at $96 on the 4-hour chart of the SOL/USD pair (data source from Kraken).
- The pair could continue to rally if it clears the $102.50 and $105.00 resistance levels.
Solana price formed a base above the $93.20 support zone and recently started a fresh increase. There was a decent increase above the $96 and $98 levels.
The price is up over 7% and there was a move above the $100 level, outperforming Bitcoin and Ethereum. During the increase, the price cleared the 76.4% Fib retracement level of the downward move from the $102.46 swing high to the $93.17 low.
Besides, there was a break above a major bearish trend line with resistance at $96 on the 4-hour chart of the SOL/USD pair. Solana is now trading above $98 and the 100 simple moving average (4 hours).
Source: SOLUSD on TradingView.com
Immediate resistance is near the $102.50 level. The next major resistance is near the $105 level. A successful close above the $105 resistance could set the pace for another major increase. The next key resistance is near $112. Any more gains might send the price toward the $120 level.
Are Dips Supported in SOL?If SOL fails to rally above the $105 resistance, it could start a downside correction. Initial support on the downside is near the $98 level.
The first major support is near the $96 level and the 100 simple moving average (4 hours), below which the price could test $93.20. If there is a close below the $93.20 support, the price could decline toward the $85 support in the near term.
Technical Indicators
4-Hours MACD – The MACD for SOL/USD is gaining pace in the bullish zone.
4-Hours RSI (Relative Strength Index) – The RSI for SOL/USD is above the 50 level.
Major Support Levels – $96, and $93.20.
Major Resistance Levels – $102.50, $105, and $112.
Why this matters
This altcoin story adds another data point to the current market tape and is useful when read alongside nearby source coverage.
Original source
Read on NewsBTCRelated market context

Anthropic Claude AI Predicts a Historic Move for Bitcoin Cash: How High Can It Go?
Anthropic’s Claude AI predicts an exceptionally bullish move for Bitcoin Cash (BCH) by January 1, 2027. It suggests a price range...

Sam Altman ChatGPT AI Predicts a Huge Bitcoin Crash: Can BTC Really Go This Low?
Something potentially severe could be approaching for Bitcoin by January 1, 2027. Sam Altman’s ChatGPT AI predicts that in the eve...

Elon Musk’s Grok AI Predicts Lighter Crypto to Flip Hyperliquid
Elon Musk’s AI bot has made an insanely controversial call. Grok AI predicts a potentially significant development for Lighter by...

Vitalik Devcon Cosplay Steals the Show as Bitmine Loads Up on More Ethereum
Devcon attendees got an unexpected laugh when Ethereum co-founder Vitalik Buterin appeared on stage wearing a green cloak and a sm...

Microsoft Bearish On Ripple? Copilot AI Predicts a Huge XRP Crash Looms
Is Microsoft bearish on Ripple? Its AI bot, Copilot AI, predicts that something potentially severe could be approaching for XRP by...

Brazil’s Mercado Bitcoin Freezes Deposits and Withdrawals Due to Ongoing Security Incident, Losses Estimated Near $40 Million
Bitcoin Magazine Brazil’s Mercado Bitcoin Freezes Deposits and Withdrawals Due to Ongoing Security Incident, Losses Estimated Near...