SOL Price Corrects Gains But The Rally Is Far From Over – Here’s Why
Solana rallied above the $100 and $110 levels. SOL price is now correcting gains, but the bulls might remain active near the $100 level. SOL price started a fresh rally above the $100 resistance against the US Dollar. Th...
Archive context
Older archive item. Useful for background and entity history, but not a fresh market-moving signal.

Solana rallied above the $100 and $110 levels. SOL price is now correcting gains, but the bulls might remain active near the $100 level.
- SOL price started a fresh rally above the $100 resistance against the US Dollar.
- The price is now trading above $100 and the 100 simple moving average (4 hours).
- There is a key bullish trend line forming with support near $102 on the 4-hour chart of the SOL/USD pair (data source from Kraken).
- The pair could start a fresh rally unless there is a close below the $100 support.
In the past few days, Solana saw a major upward move above the $90 and $100 levels, unlike Bitcoin and Ethereum. SOL even rallied above the $120 level.
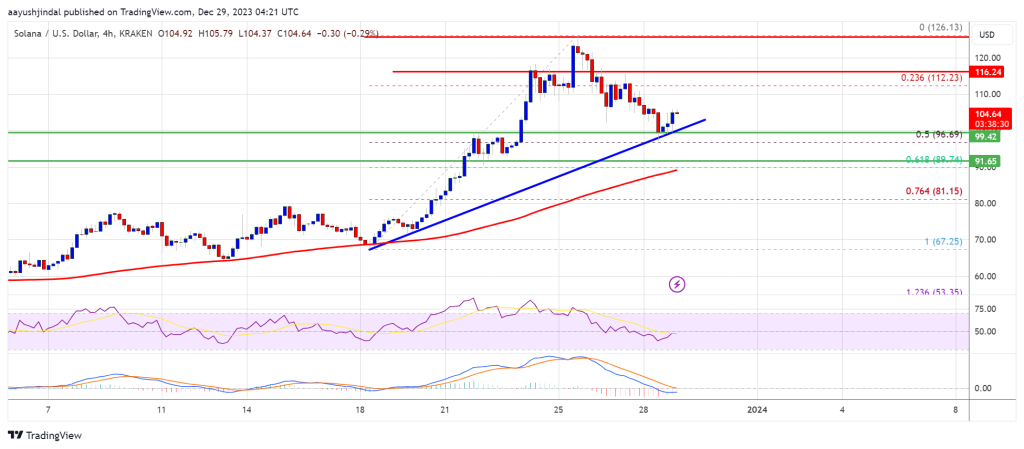
A new multi-week high was formed near $126.13 and the price is now correcting gains. There was a move below the $115 and $112 levels. The price declined below the 23.6% Fib retracement level of the upward move from the $67.25 swing low to the $126.13 high.
SOL is now trading above $100 and the 100 simple moving average (4 hours). There is also a key bullish trend line forming with support near $102 on the 4-hour chart of the SOL/USD pair.
Source: SOLUSD on TradingView.com
On the upside, immediate resistance is near the $112 level. The first major resistance is near the $120 level. The main resistance is now near $125. A successful close above the $125 resistance could set the pace for another major rally. The next key resistance is near $132. Any more gains might send the price toward the $145 level.
More Losses in SOL?If SOL fails to rally above the $120 resistance, it could continue to move down. Initial support on the downside is near the $100 level.
The first major support is near the $90 level or the 61.8% Fib retracement level of the upward move from the $67.25 swing low to the $126.13 high, below which the price could test $80. If there is a close below the $80 support, the price could decline toward the $68 support in the near term.
Technical Indicators
4-Hours MACD – The MACD for SOL/USD is losing pace in the bullish zone.
4-Hours RSI (Relative Strength Index) – The RSI for SOL/USD is below the 50 level.
Major Support Levels – $100, and $92.
Major Resistance Levels – $115, $120, and $125.
Why this matters
This altcoin story adds another data point to the current market tape and is useful when read alongside nearby source coverage.
Original source
Read on NewsBTCRelated market context

Ethereum (ETH) Price Prediction: ETH Holds Near $1,580 as Bulls Watch $1,750 Reclaim and $1,070–$1,370 Bid Zone
Ethereum price is back in focus as ETH trades near $1,579.52 after a small 24-hour recovery, according to Brave New Coin data. The...

‘I See Volatility as Opportunity’: Bitcoin Tests Critical Support as Key Level Hangs in the Balance
Bitcoin Magazine ‘I See Volatility as Opportunity’: Bitcoin Tests Critical Support as Key Level Hangs in the Balance Bitcoin has s...

Bitcoin nearly loses $58K as ETF outflows decide whether inflation relief holds
Bitcoin registered an intraday low of $58,189 on June 25 before clawing back toward $60,100 as of press time, even as the Federal...

Bitcoin’s weekend test is whether the $58,000 drop was exhaustion or acceptance
Bitcoin enters the weekend near $60,000 after sticky inflation, heavy ETF outflows, and a failed defense of the $59,000-$62,000 zo...

XRP Tests $1 Support As Long Liquidations Surge Inside Multi-Month Wedge
XRP’s latest sell-off has put the $1 level back at the center of market attention, with traders watching whether the token can hol...

Bitcoin’s broken production cost floor is splitting miners into survivors and sellers
Bitcoin is trading just above $60,000 right now, and the network's estimated all-in cost to produce a single coin is near $84,300,...